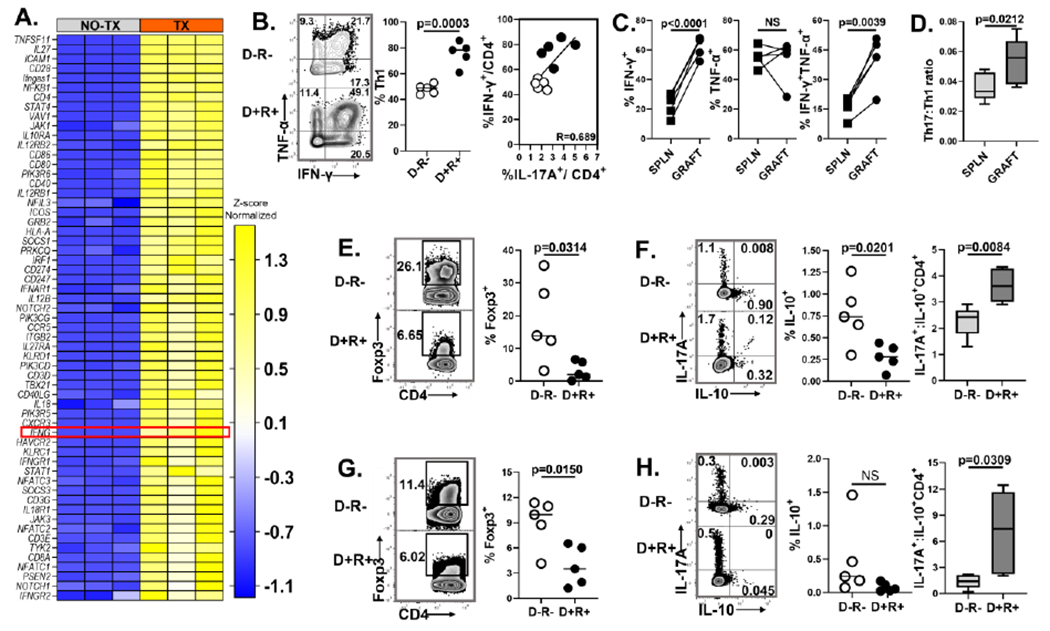
Figure 5. MCMV infection is associated with increased Th1 cells and decreased Tregs.

(A) Heat map shows differential expression of transcripts involved with Th1 cell activation in D+ allografts (TX) compared to non-transplant MCMV infected kidneys (NO TX). Hierarchical clustering of the genes was performed based on the average column z- score, highest to lowest. (B) Representative flow plots and frequencies of Th1 cells in D−R− and D+R+ allografts. Intragraft frequencies of Th17 cells were correlated with Th1 cells in D−R− and D+R+ transplants. (C) Frequencies of IFN-γ and/or TNF-α expressing Th1 cells in D+R+ spleens and allografts. (D) Ratio of Th17:Th1 cell infiltrates in D+R+ spleens and allografts. (E-F) Representative flow plots and frequencies of (E) Foxp3+ Tregs and (F) IL-10 expressing Tregs in allografts. (F) Box plot shows ratio of Th17: Treg cells (IL-17A+: IL-10+ CD4+). (G-H) Representative flow plots and frequencies of (G) Foxp3+ Tregs and (H) IL-10 expressing Tregs in spleens. (H) Box plot shows ratio of Th17: Treg cells in spleens. All data are represented as mean ± standard deviation (SD) and are analyzed by two- sided Student’s t-test or Pearson correlation. NS, not significant (p>0.05).
