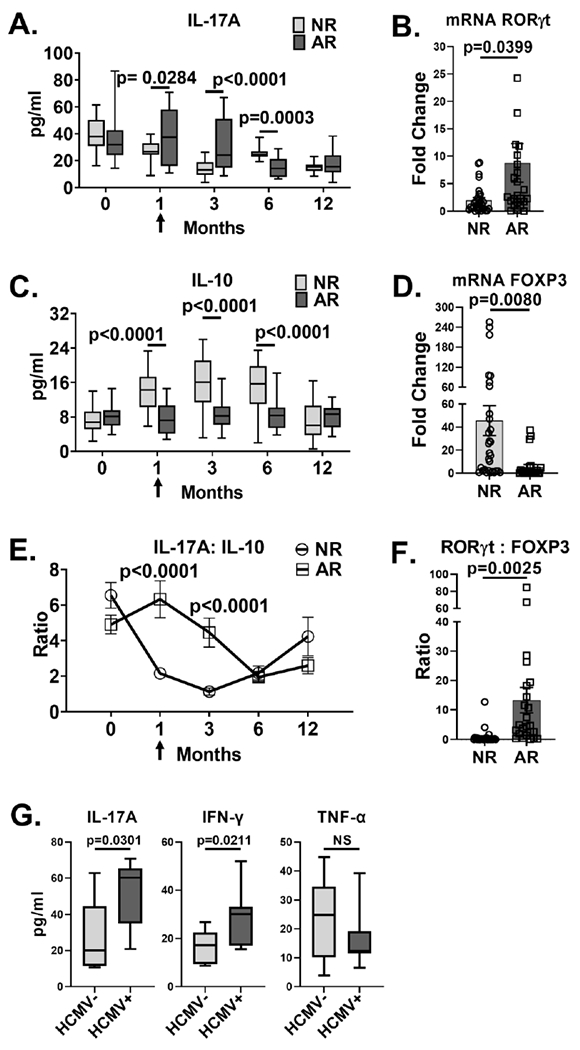
Figure 8. CMV DNAemia is associated with elevated serum IL-17A and IFN-γ in kidney transplant patients with acute rejection.

Clinical renal transplant recipients with acute rejection (AR, N=24) were compared to those with no rejection (NR, N=29) over the first 12 months post-transplant. Blood was analyzed at pre- transplant (0), 1-, 3-, 6- and 12- months post-transplant and at the time of AR (arrow). (A, C, E) Serum cytokine levels were measured at indicated post-transplant timepoints. (B, D) Expression of transcription factors were quantified in whole blood by RT-PCR at the time of AR. (F) RORγt: FOXP3 mRNA ratio was compared at the time of rejection for AR and NR groups. (G) HCMV DNAemia in the AR group was determined by quantitative DNA PCR. Serum cytokine quantities were compared for patients with (HCMV+) and without (HCMV−) HCMV DNAemia. All data are represented as mean ± SEM and are analyzed by two- sided Student’s t-test. NS, not significant (p>0.05).
