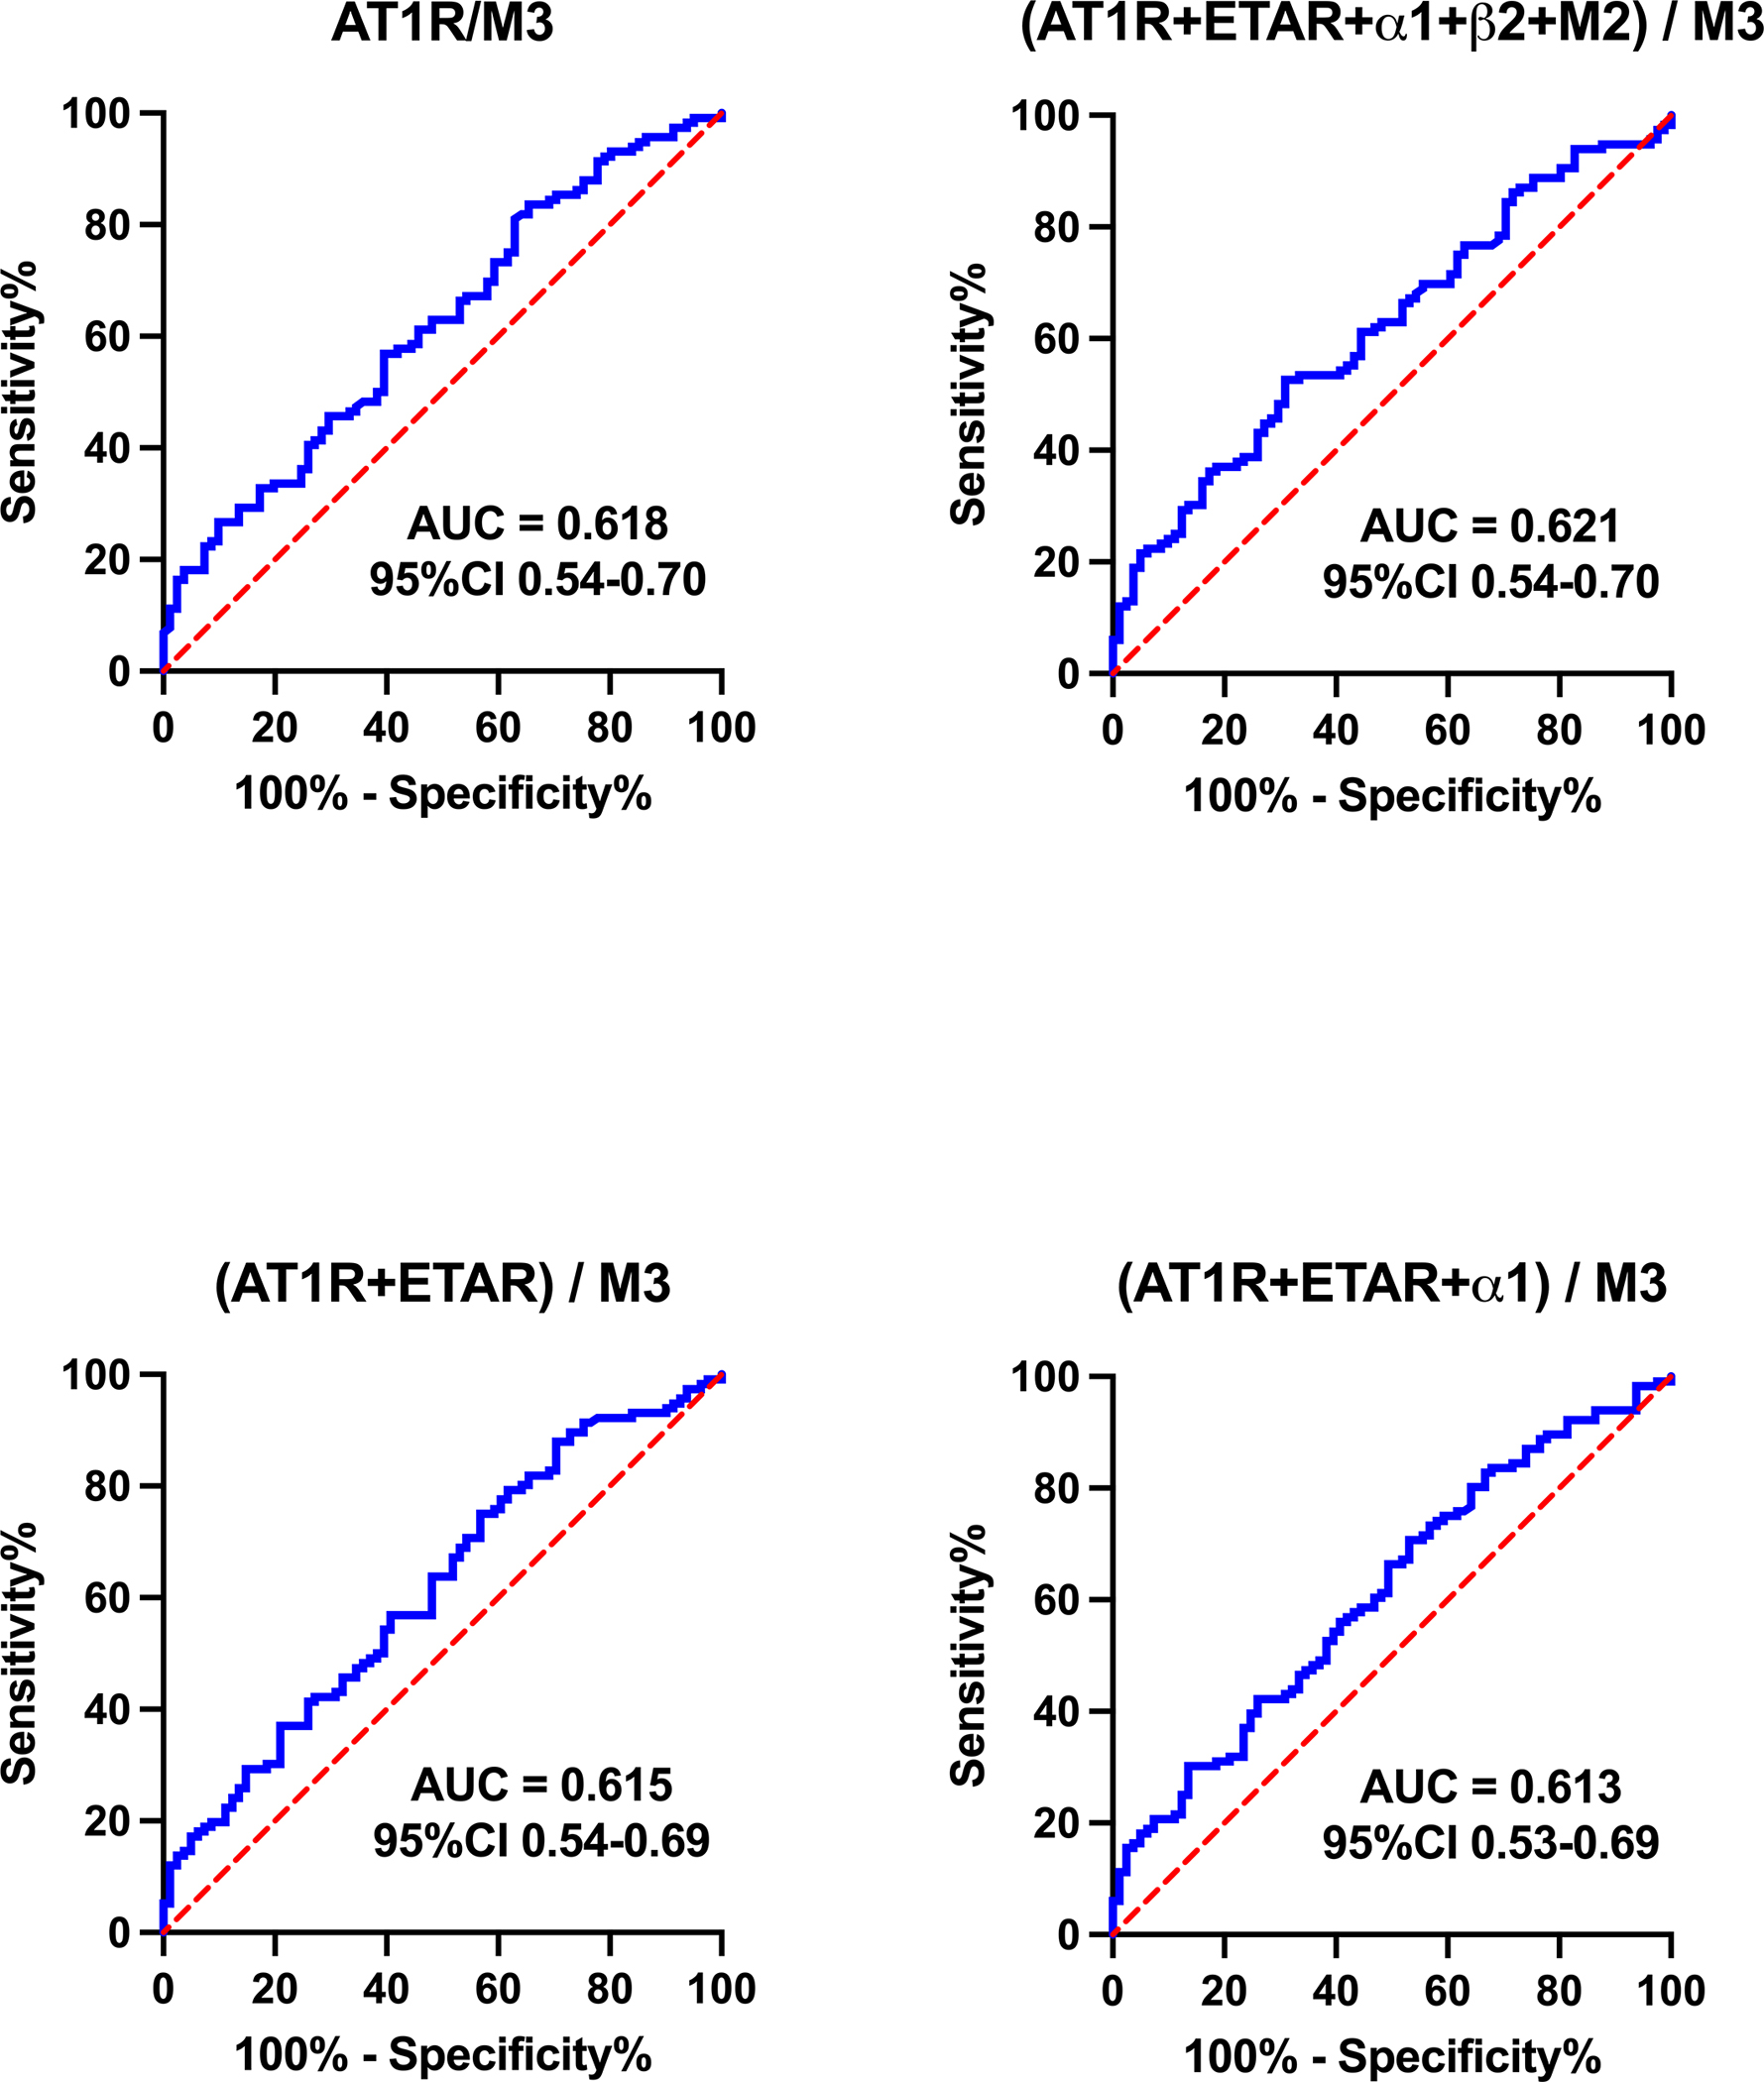
Figure 3. Receiver operating characteristic (ROC) curves for combinations of autoantibody concentrations to GPCRs.

Data are presented as area under the curve (AUC) and 95% confidence interval (CI). A greater AUC indicates greater ability for the concentration of that autoantibody to discriminate whether a person has POTS. Abbreviations as in Figure 1.
