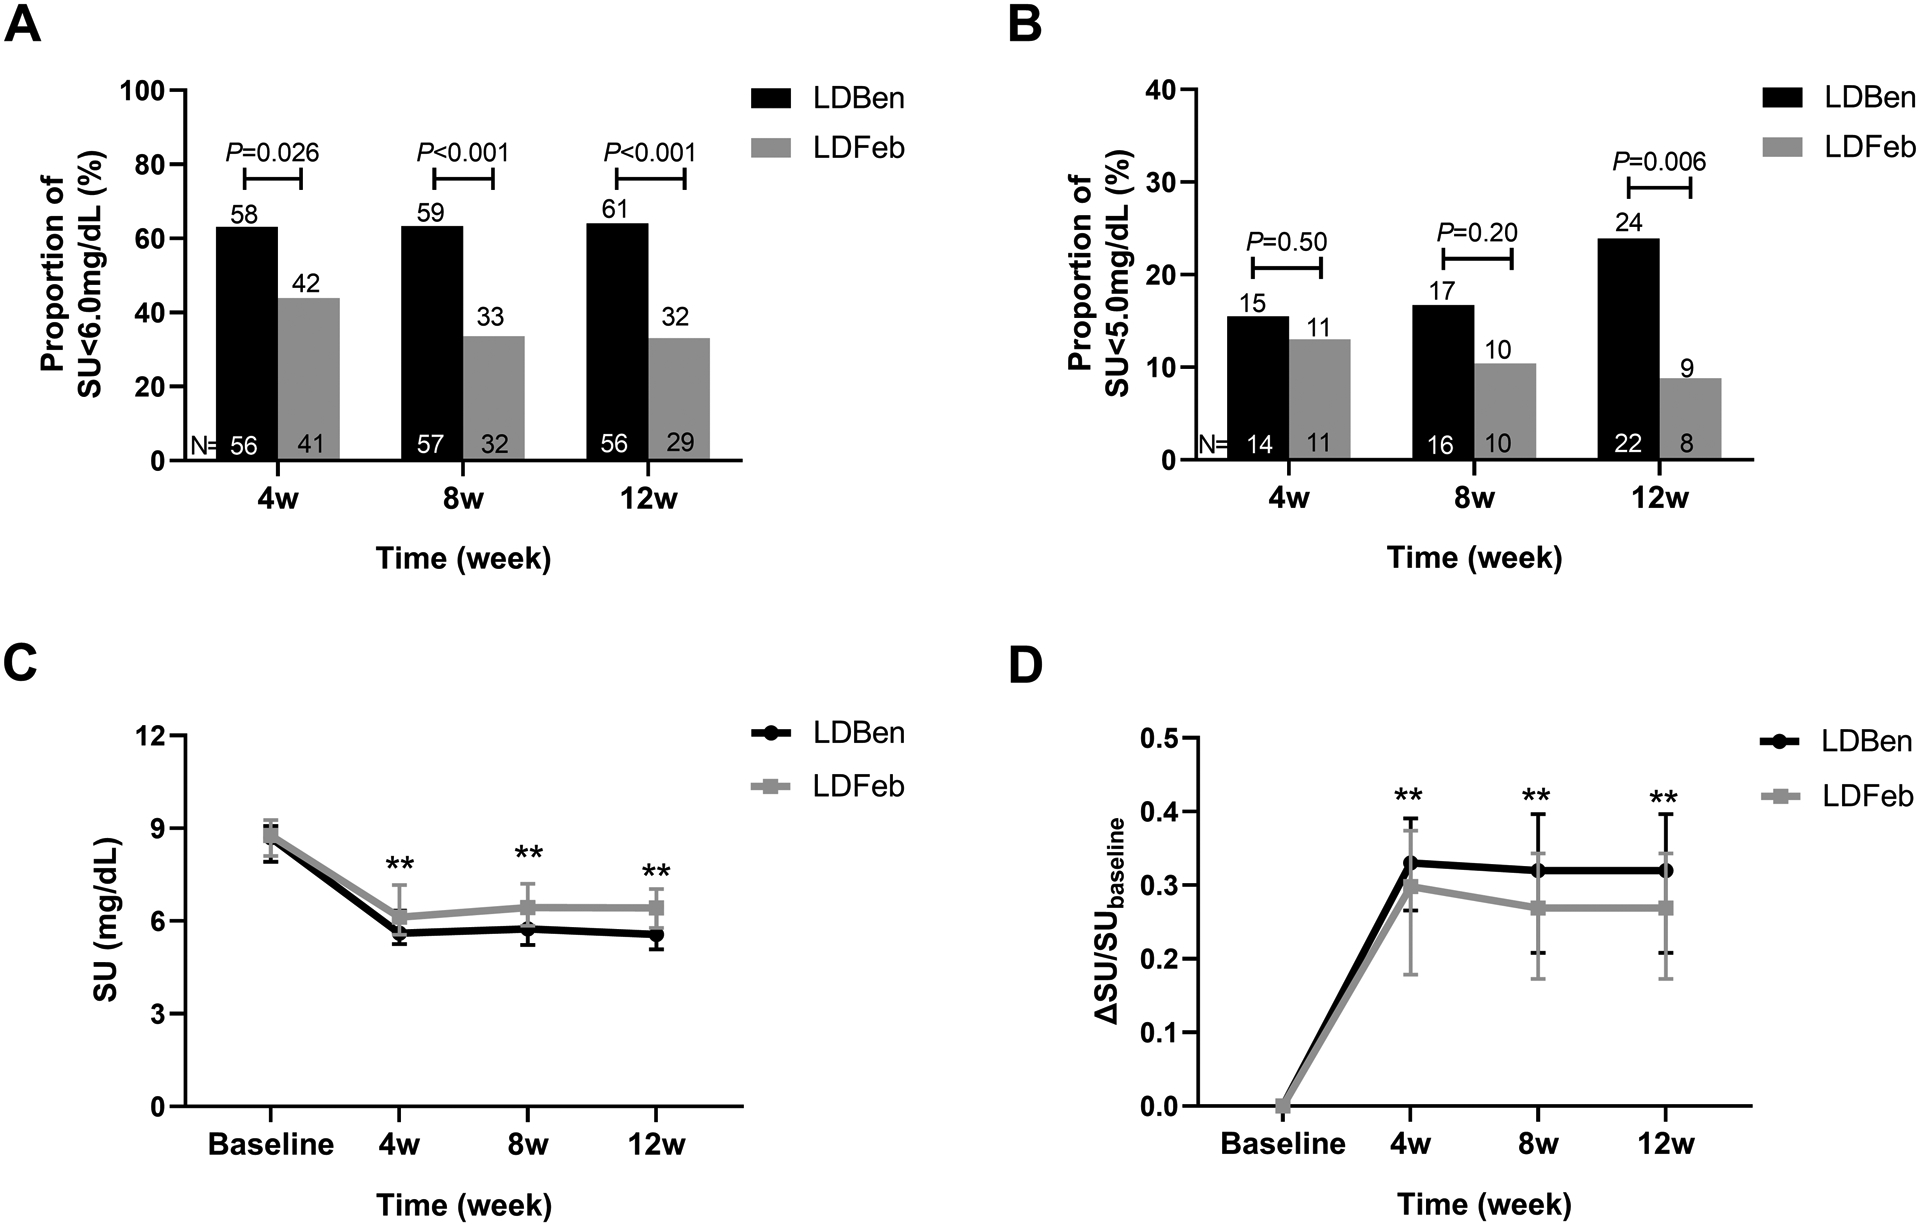
Figure 2.

The efficacy of the two groups. (A) Proportion of participants with SU < 6.0 mg/dL at weeks 4, 8 and 12. (B) Proportion of participants with SU<5.0 mg/dL at week 4, 8 and 12. (C) The trend of serum urate level of the two groups at 4, 8 and 12 weeks. (D) The ΔSU of the two groups at 4, 8 and 12 weeks. ΔSU= (baseline SU- visit SU)/baseline SU. The data at the bottom of the bar chart shows the number of participants, the data at the top of the bar chart shows the percentage of participants.
