
Figure 1. NCOA4 is a dependency in PDAC.
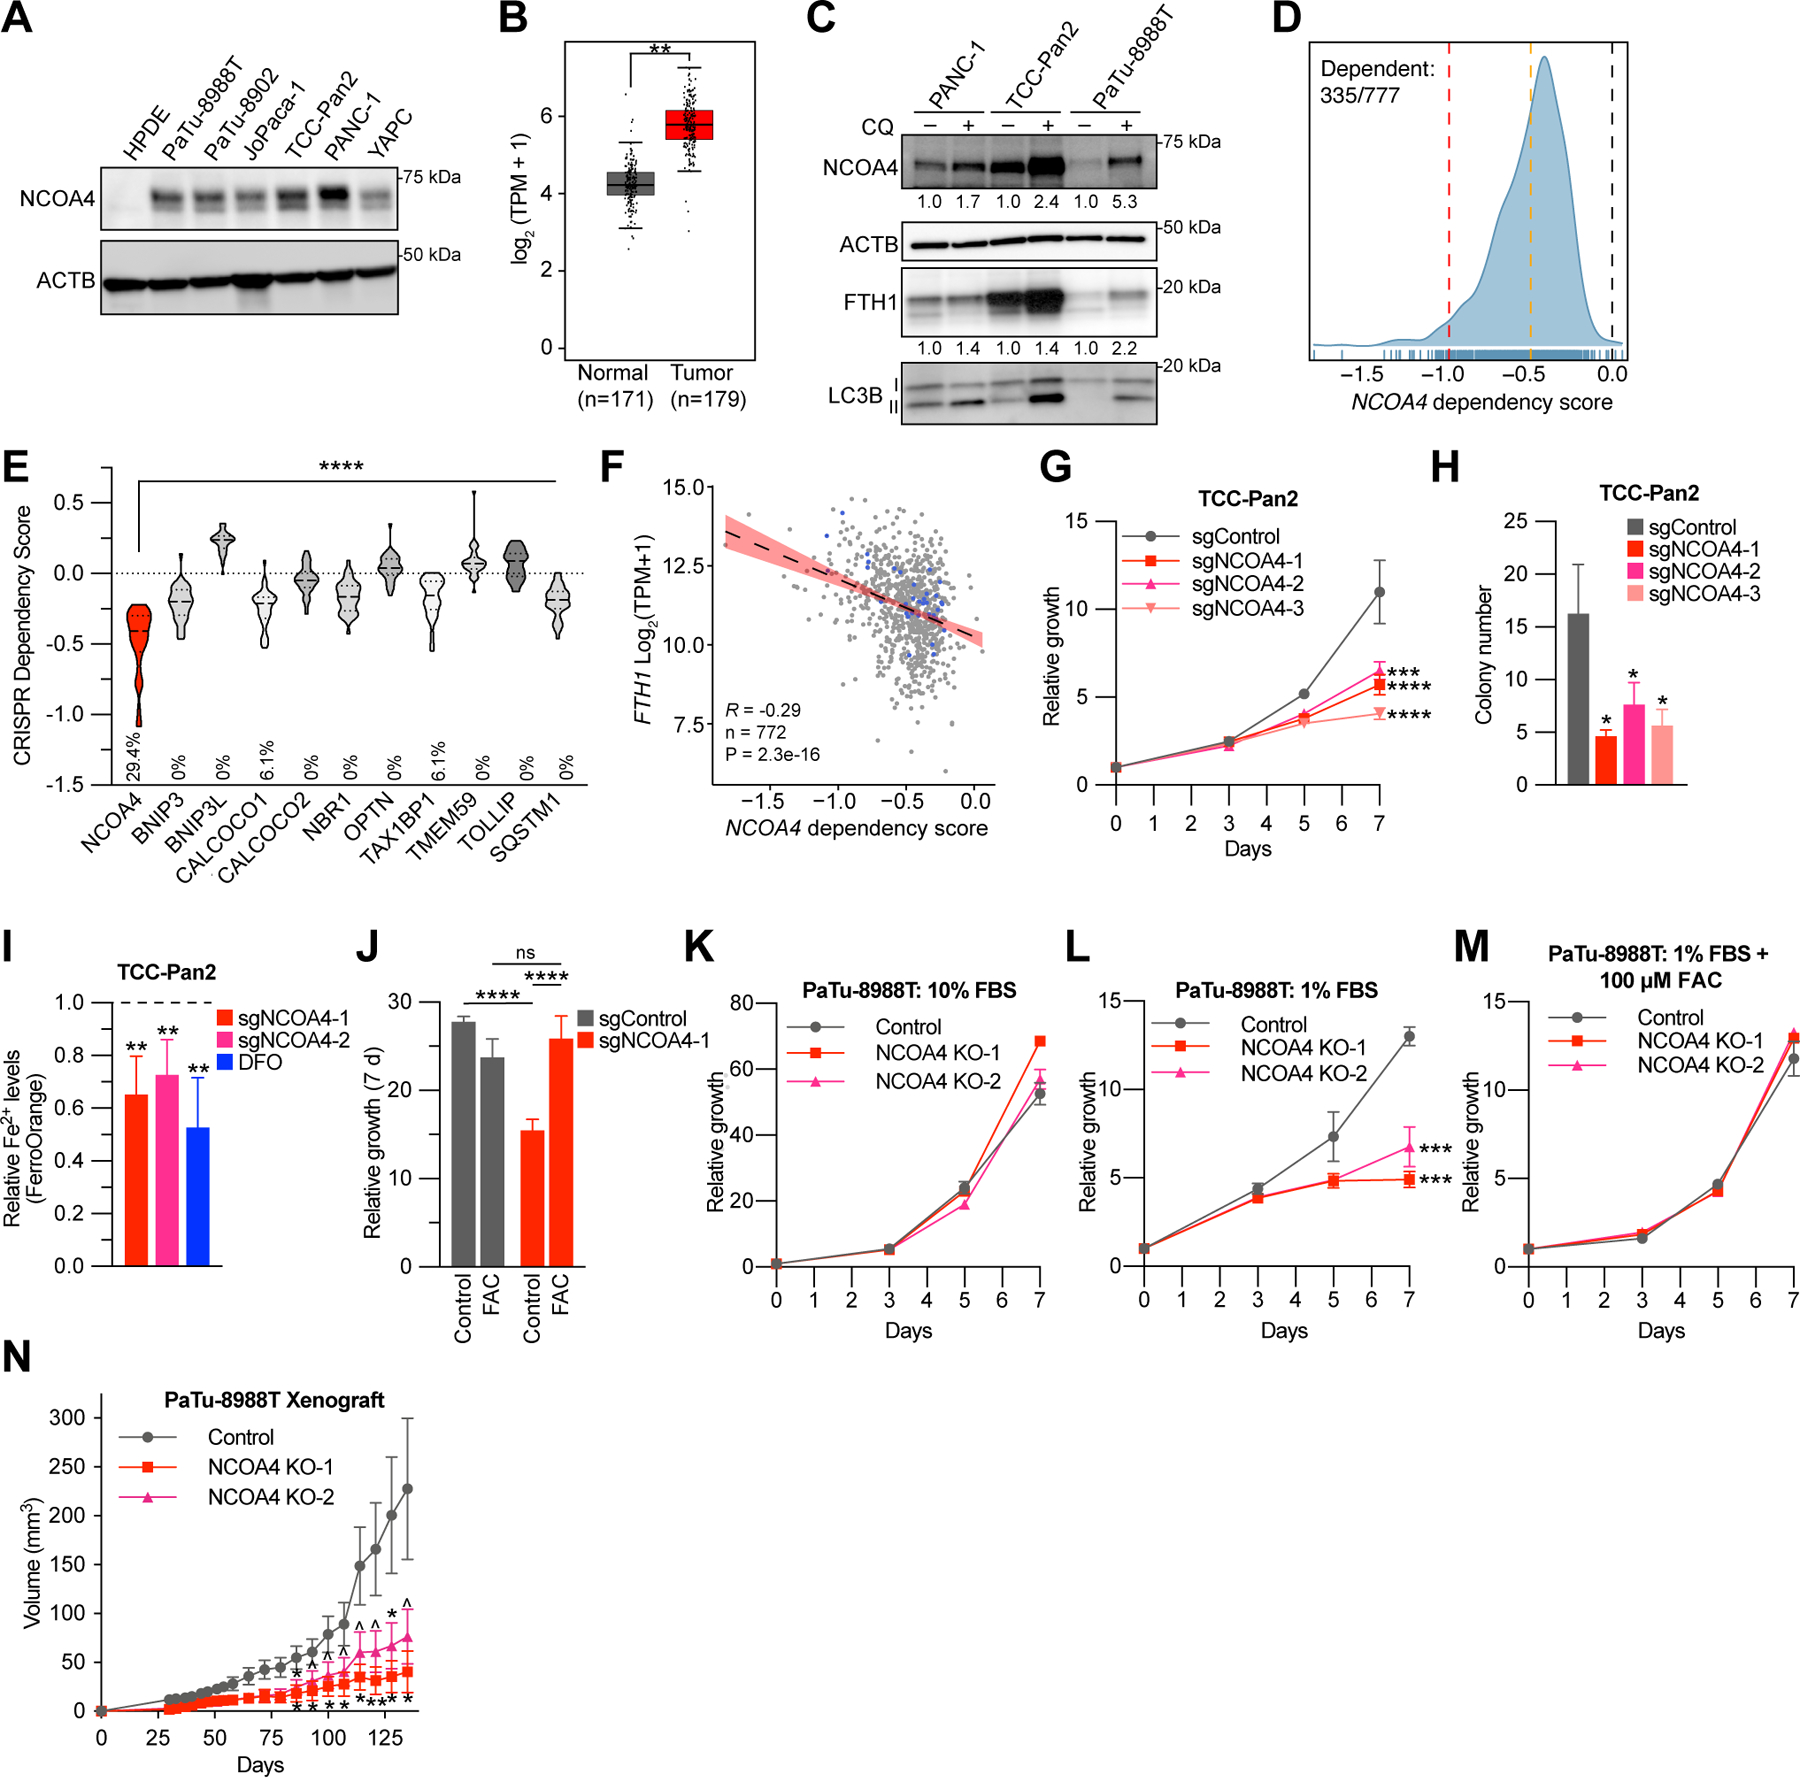
A, Immunoblot showing NCOA4 protein levels in lysates from HPDE (human pancreatic ductal epithelial) and PDAC cell lines, as indicated. B, NCOA4 mRNA expression levels in human normal pancreas tissue (GTEx and TCGA normal, n=171 patients) versus human PDAC tumor (TCGA, n=179 patients). The data are presented as box-and-whisker plots, boxes represent the median and the 25th and 75th percentiles (** p<0.01, t-test, as calculated in GEPIA2 database). C, Immunoblot showing NCOA4, FTH1, and MAP1LC3B (LC3B) protein levels in lysates from PDAC cell lines treated with or without chloroquine (CQ) (10 μM for 16 h). NCOA4 and FTH1 relative quantification (normalized within each cell line) denoted below each lane. D, Smoothed histogram showing the distribution of NCOA4 dependency scores from the CRISPR-spCas9 Cancer Dependency Map dataset (21Q1) across cancer cell lines. The number of dependent cell lines (CRISPR score less than −0.5, orange line) over the total number of probed cell lines is shown in the top left corner. Red line at −1: CRISPR score for a set of control highly essential genes. Black line at 0: CRISPR score of negative control sgRNAs. E, Violin plot of CRISPR dependency scores of selective autophagy receptor genes in PDAC cell lines represented in the Cancer Dependency Map (n=34), Dashed line: median value, Dotted line: quartile values. Percentage of cell lines scored as dependent (CRISPR score less than −0.5) indicated at bottom of graph (p<0.0001 for all comparisons to NCOA4 using ANOVA with Dunnett’s multiple comparison test). F, Scatter plot showing linear regression with 95% confidence interval (black line) and Pearson’s correlation coefficient between FTH1 mRNA expression (y-axis) and NCOA4 CRISPR dependency scores (x-axis) across 772 cancer cell lines, blue dots represent data for PDAC cell lines. G, Relative proliferation of pools of TCC-Pan2 cells lentivirally transduced with control Cas9-sgRNA targeting the non-essential Rosa26 locus (sgControl) or three independent Cas9-sgRNAs targeting NCOA4 (sgNCOA4). Data are plotted as relative cell proliferation in arbitrary units. Values normalized to Day 0. Error bars represent s.d. of 6 technical replicates (representative of 3 independent experiments). NCOA4 depletion/’knockdown’ level (>90%) is displayed in Supplementary Fig. S1E. H, Clonogenic growth of TCC-Pan2 NCOA4 ‘knockdown’ cells expressing lentiviral sgRNAs as in G. Error bars ± s.d. triplicate wells of a representative experiment of 3 independent experiments. I, Quantification of intracellular Fe2+ by FerroOrange staining and flow cytometry in TCC-Pan2 NCOA4 KD cells. Mean fluorescence intensity was normalized to cells transduced with sgControl. DFO (100 μM) was used as a positive control. Dotted line indicates sgControl normalized intensity level. Error bars ± s.d. of 4 independent experiments. J, Relative proliferation measured at 7 d of TCC-Pan2 cells expressing sgControl or sgNCOA4-1 treated with or without ferric ammonium citrate (FAC) (50 μM) and ferrostatin-1 (500 nM, see methods). Values normalized to Day 0. Error bars ± s.d., triplicate wells of a representative experiment of 3 independent experiments. K, Relative proliferation of control versus NCOA4 clonal KO PaTu-8988T cells grown in media containing 10% FBS. Values normalized to Day 0. Error bars represent s.d. of 3 technical replicates (representative of 3 independent experiments). L, Relative proliferation of control versus NCOA4 KO PaTu-8988T cells grown in media containing 1% FBS as in K. M, Relative proliferation of control versus NCOA4 KO PaTu-8988T cells grown in media containing 1% FBS with FAC (100 μM) and ferrostatin-1 (1 μM). N, In vivo subcutaneous tumor growth in immunocompromised NCr-Foxn1nu mice of PaTu-8988T control versus NCOA4 KO cells as in K. Error bars ± s.e.m., n=14–15 mice. For panels G-N, significance determined with t-test. ^ p < 0.1, * p < 0.05, ** p < 0.01, *** p < 0.001, **** p < 0.0001.