
Figure 5. NCOA4-mediated ferritinophagy supports mitochondrial iron-sulfur cluster protein levels and mitochondria structure in murine PDAC tumors.
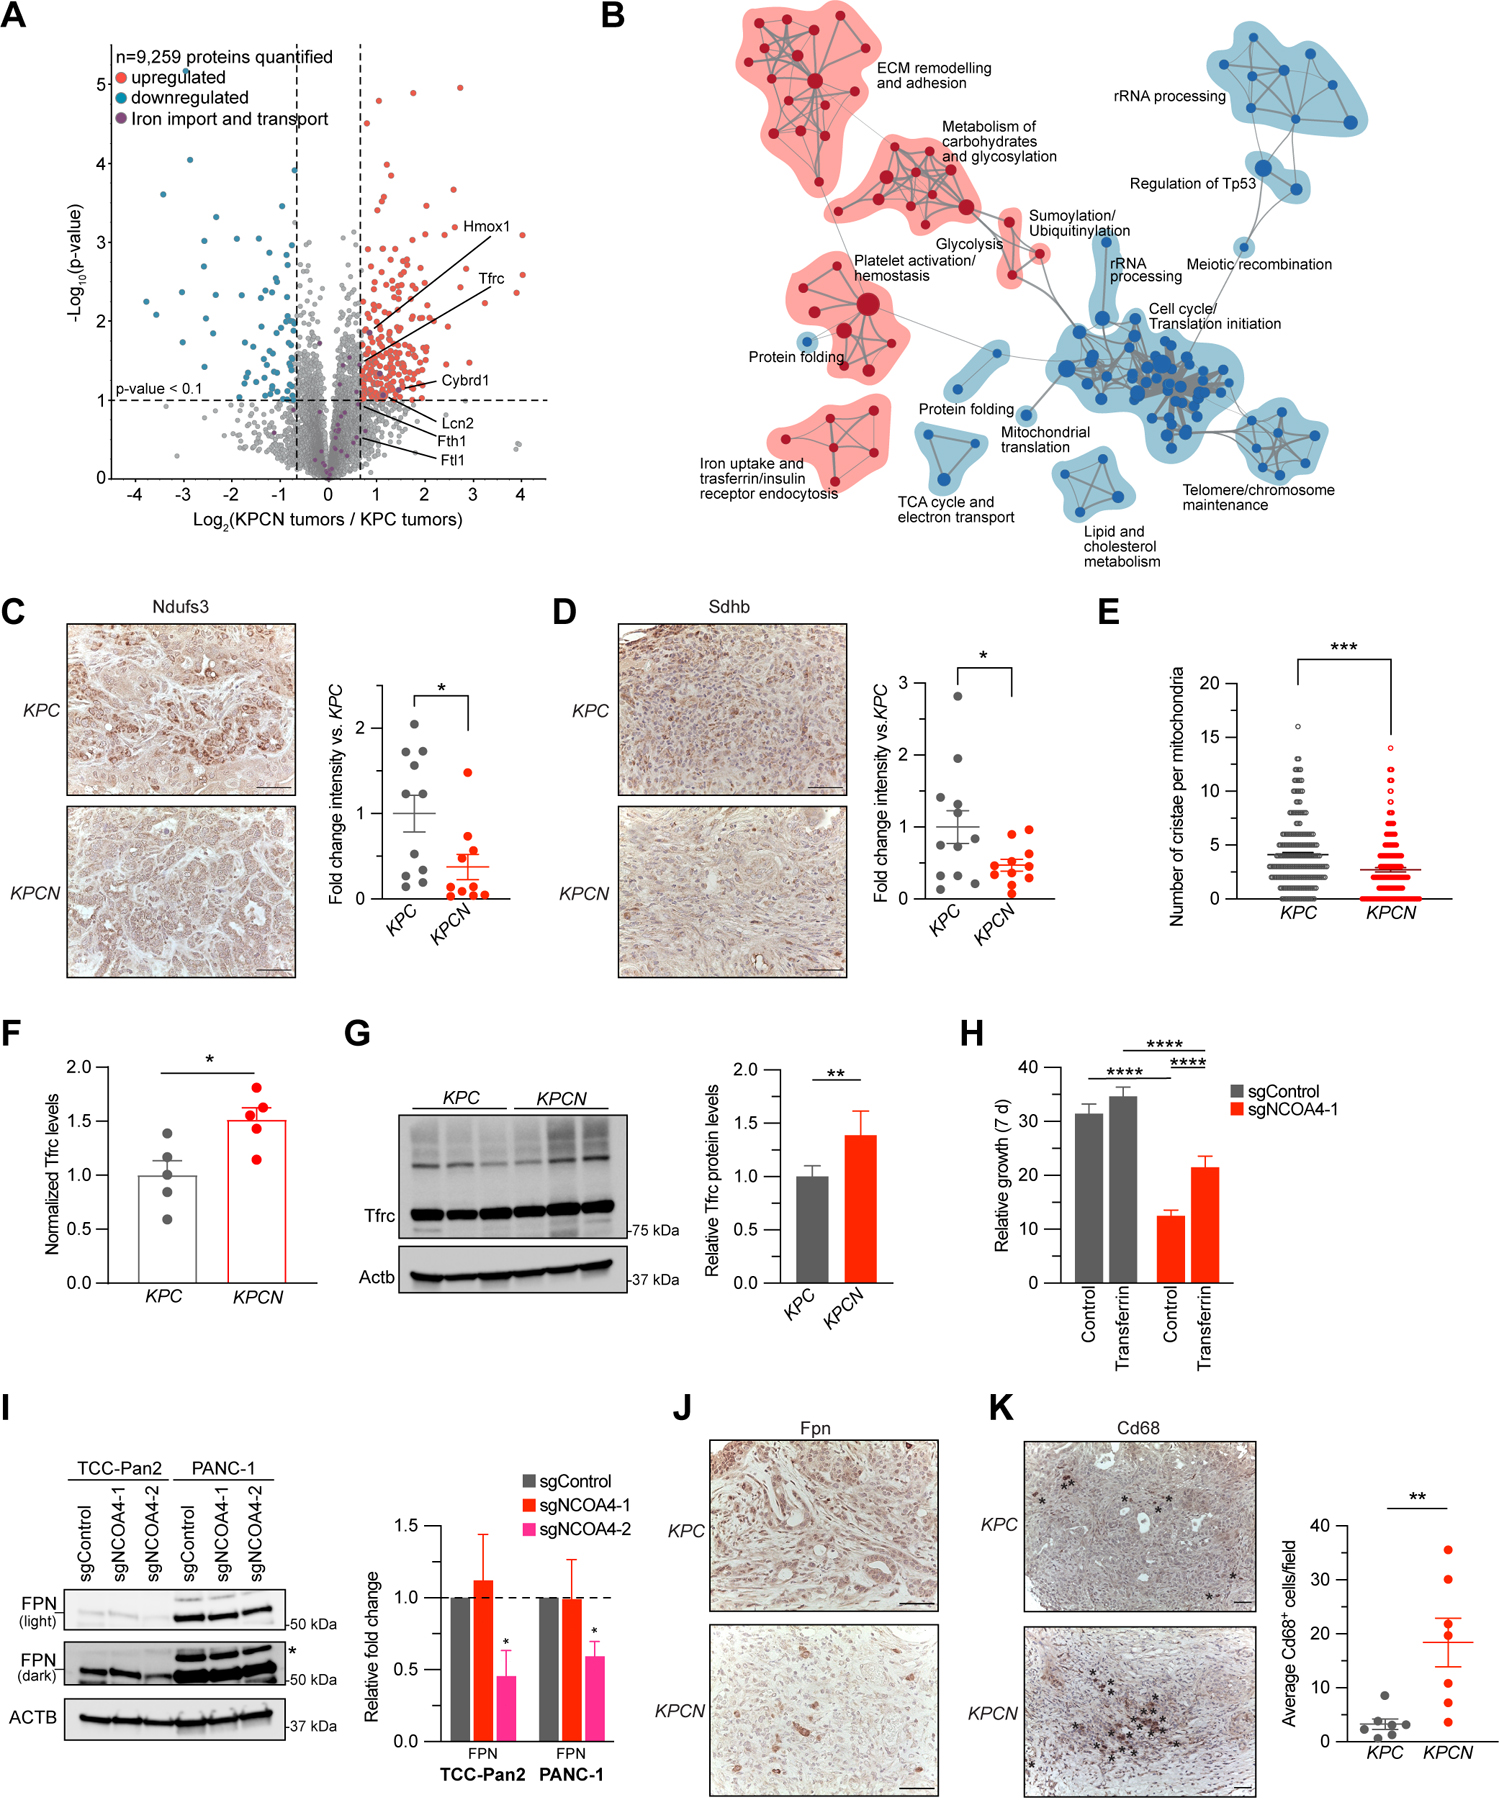
A, Volcano plot illustrates statistically significant protein abundance differences in KPCN versus KPC tumors. Volcano plots display the −log10 (p value) versus the log2 of the relative protein abundance of mean KPCN to KPC tumors (n=5 tumors per genotype, proteins with log2 fold change between −4 to 4 are graphed). Purple circles represent iron transport proteins identified in the dataset. Red circles represent significantly upregulated (log2 fold change>0.7) while blue circles represent significantly down-regulated proteins (log2 fold change<−0.7). B, Enrichment map of gene set enrichment analysis (GSEA-Reactome) of KPCN compared to KPC tumor proteomes. (p < 0.005, FDR q value <0.05; Jaccard coefficient >0.5). Node size is related to the number of components identified within a gene set, and the width of the line is proportional to the overlap between related gene sets. GSEA terms associated with upregulated (red) and downregulated (blue) proteins are colored accordingly and grouped into nodes with associated terms. C, Ndufs3 immunostaining of tumors from KPC and KPCN tumors at endpoint, representative image displayed. Scale bar = 50 μm. Quantification of average intensity presented in relative fold change (5 random fields per sample, n=10–11 mice/group, error bars represent s.e.m.). D, Sdhb immunostaining of tumors from KPC and KPCN tumors at endpoint, representative image displayed. Scale bar = 50 μm. Quantification of average intensity presented in relative fold change (5 random fields per sample, n=11–12 mice/group, error bars represent s.e.m.). E, Quantification of mitochondrial cristae number from electron microscopy images of pancreata from KPC and KPCN mice (n=3 mice/group, 40–100 mitochondria quantified for each mouse). F, Relative protein levels of Tfrc as measured in global KPC and KPCN proteome as in A, normalized to KPC Tfrc protein levels. G, Immunoblot showing Tfrc protein levels in lysates from tumor-derived cell lines from KPC and KPCN mice (n=3 independent tumor-derived cell lines per genotype, quantification is of 3 KPC and 3 KPCN cells with 2 replicates). H, Relative proliferation measured at 7 d of TCC-Pan2 cells expressing sgControl versus sgNCOA4-1 treated with or without Transferrin, 10 μM. Values normalized to Day 0. Error bars ± s.d., n=6 wells of a representative experiment of 3 independent experiments. I, Immunoblot showing Ferroportin (SLC40A1/FPN) protein levels in lysates from TCC-Pan2 and PANC-1 cell lines lentivirally transduced with sgControl, sgNCOA4-1, or sgNCOA4-2. Relative fold-change quantification is of 3 replicates. J, Fpn immunostaining of tumors from KPC and KPCN tumors at endpoint, representative image displayed, Scale bar = 50 μm. K, Cd68 immunostaining of tumors from KPC and KPCN mice at endpoint. Representative field, Scale bar = 50 μm, Cd68 positive cells indicated by asterisks. Quantification (at least 5 fields per sample) of average Cd68+ cells per field (n=7 mice/group, error bars represent s.e.m.). For panels C-I and K significance determined with t-test. * p < 0.05, ** p < 0.01, *** p < 0.001, **** p < 0.0001. Error bars for C-F and K ± s.e.m. for G-I ± s.d.