
Figure 1. Trajectories for changing trends of three dimensions of COVID-19 risk perception and COVID-19 daily new cases.
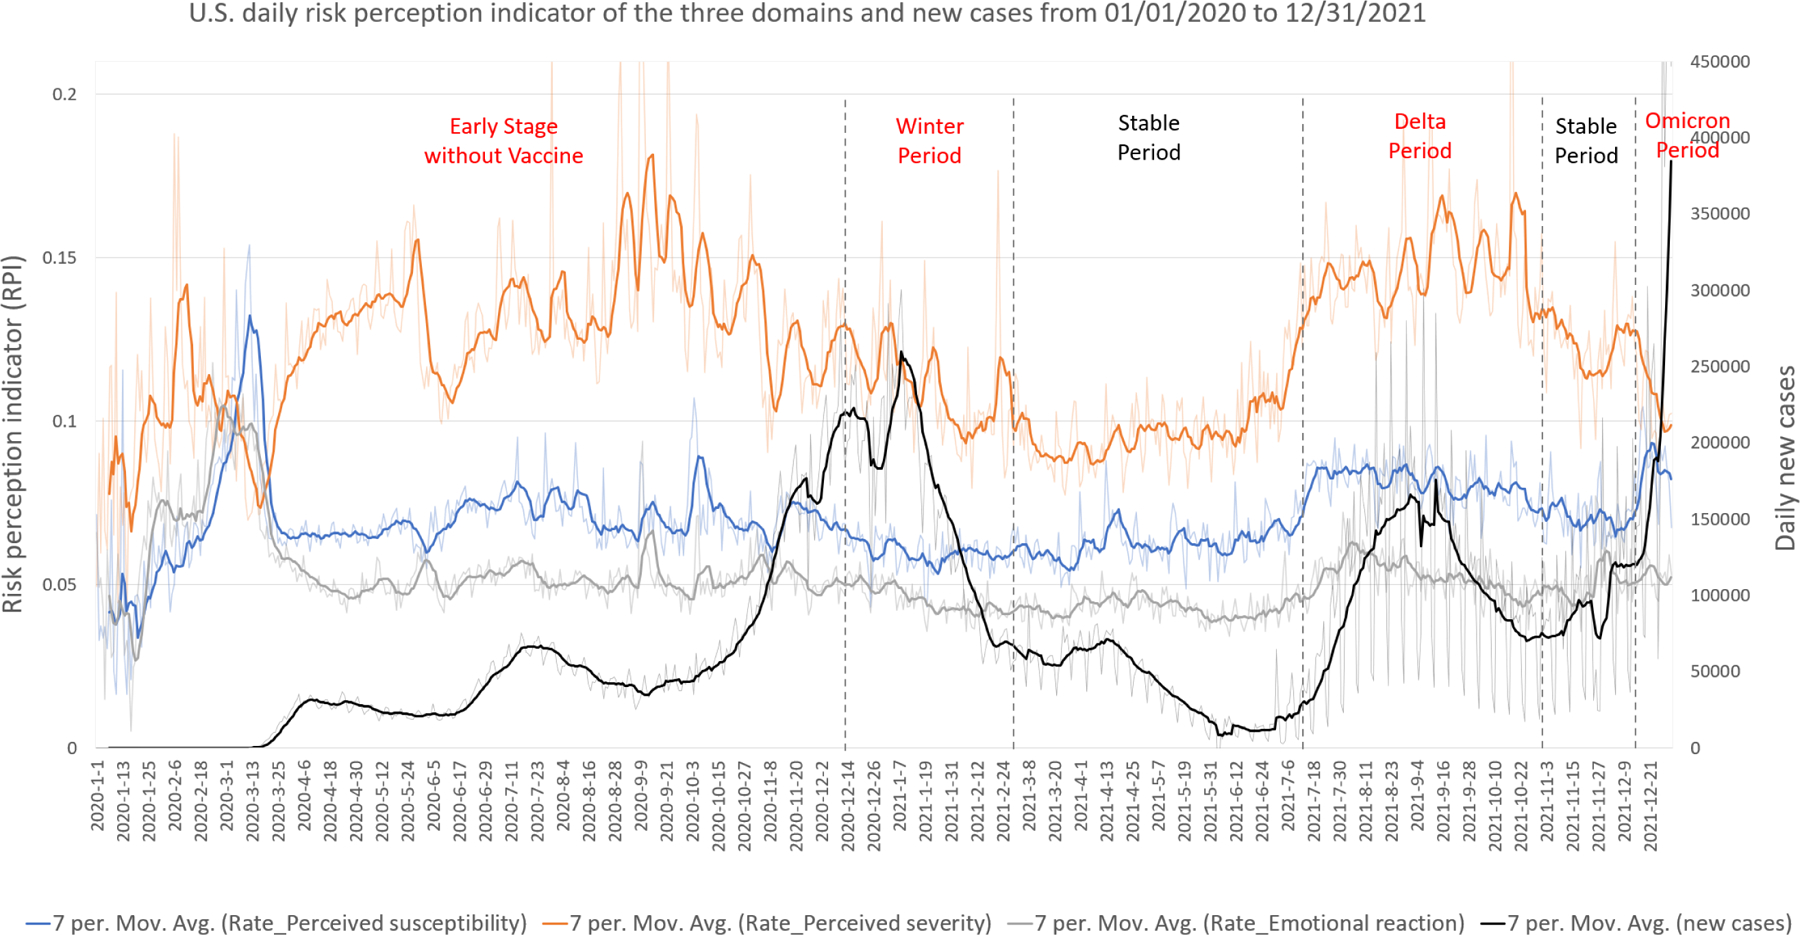
Note: The scale of RPI (left) is different from the scale of daily new COVID-19 cases (right). The figure aims to show the trends of different trajectories.