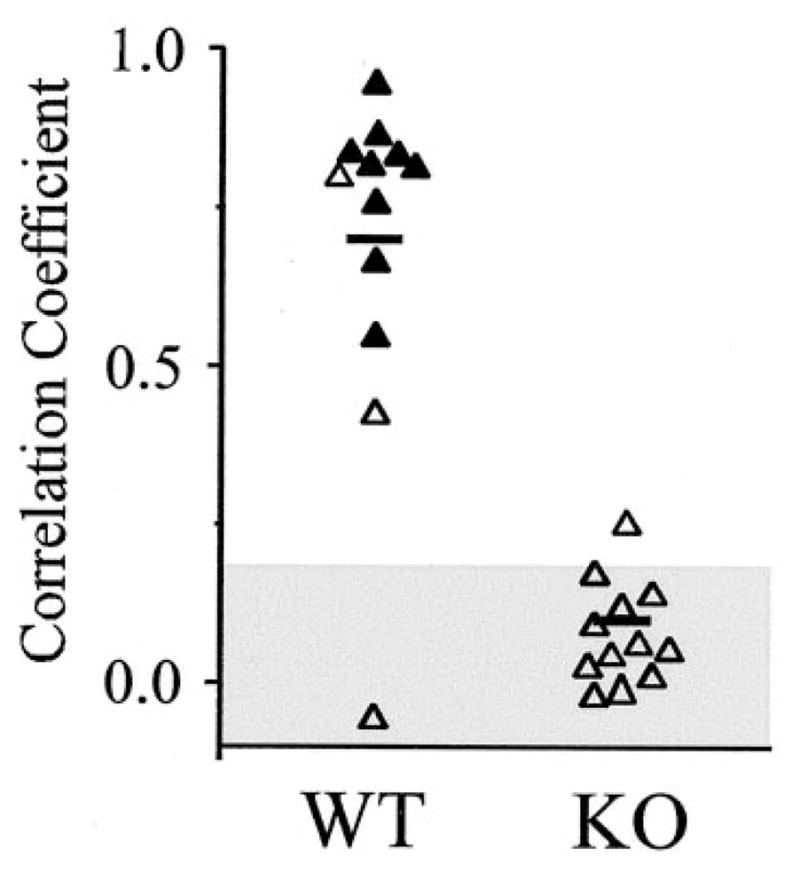
Figure 5.

Rhythms of electrically uncoupled IO neurons are asynchronous. The graph plots the peak correlations obtained from cross-correlograms of 12 WT and KO neuron pairs, obtained as described in Figure 3C. Filled triangles are from cell pairs that were measurably, electrically coupled; open triangles are from pairs that were not coupled. Horizontal lines are mean values. The shaded area shows the 95% confidence interval, derived from shuffled data of 10 WT neurons.
