Figure 6.
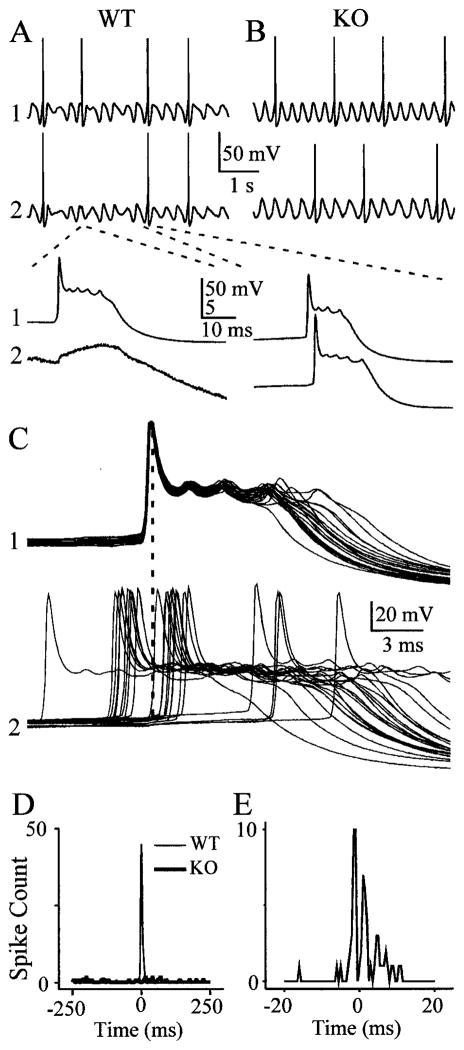
Action potentials are synchronized by electrical coupling. A, Spontaneous spiking from two WT neurons during a 4-sec-long epoch of spontaneous subthreshold rhythms shows simultaneous spiking. The traces below show magnified views of an action potential in the top cell, a subthreshold spikelet in the bottom cell (left), and two nearly simultaneous spikes (right). Dashed lines show where top traces are expanded in bottom traces. B, A similar 4 sec epoch of rhythmic activity in two KO neurons shows only asynchronous spiking. C, When 22 spiking epochs from the WT pair are aligned on the spikes of one cell, it is evident that spikes in the second cell most often occur with a brief lag or lead. Dashed line is aligned with peaks of spikes in cell 1. D, Spike cross-correlogram (5 msec bin width) taken from 200 sec of spontaneous spiking from the pairs illustrated above. WT cells show a strong peak at 0 msec, whereas spikes from KO cells were uncorrelated. E, When the same WT spiking data were cross-correlated with finer temporal resolution (0.5 msec bin width), it is clear that the periods of highest spiking probability occurred before and after spikes in the reference neuron.

