
Figure 4. Sensitivity analysis of calcium signalling range.
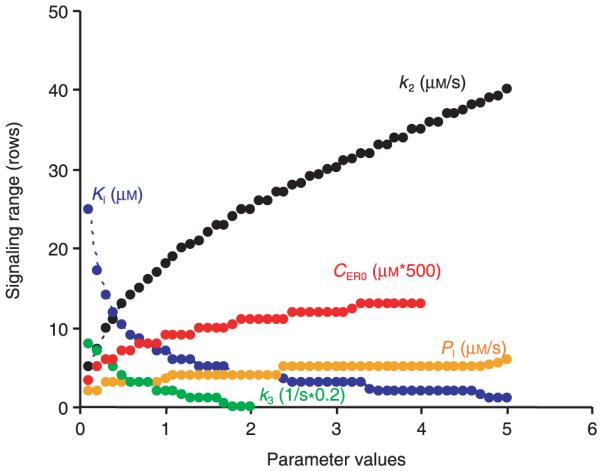
Signalling range is estimated by the mathematical model and plotted as the number of cell rows away from the wound edge. Ki: half-saturation constant for IP3 activation of IP3R; k2: rate of IP3 generation by PLCδ; CER0: the initial [Ca2+] in ER; k3: IP3 degradation rate; and PI: permeability of IP3.