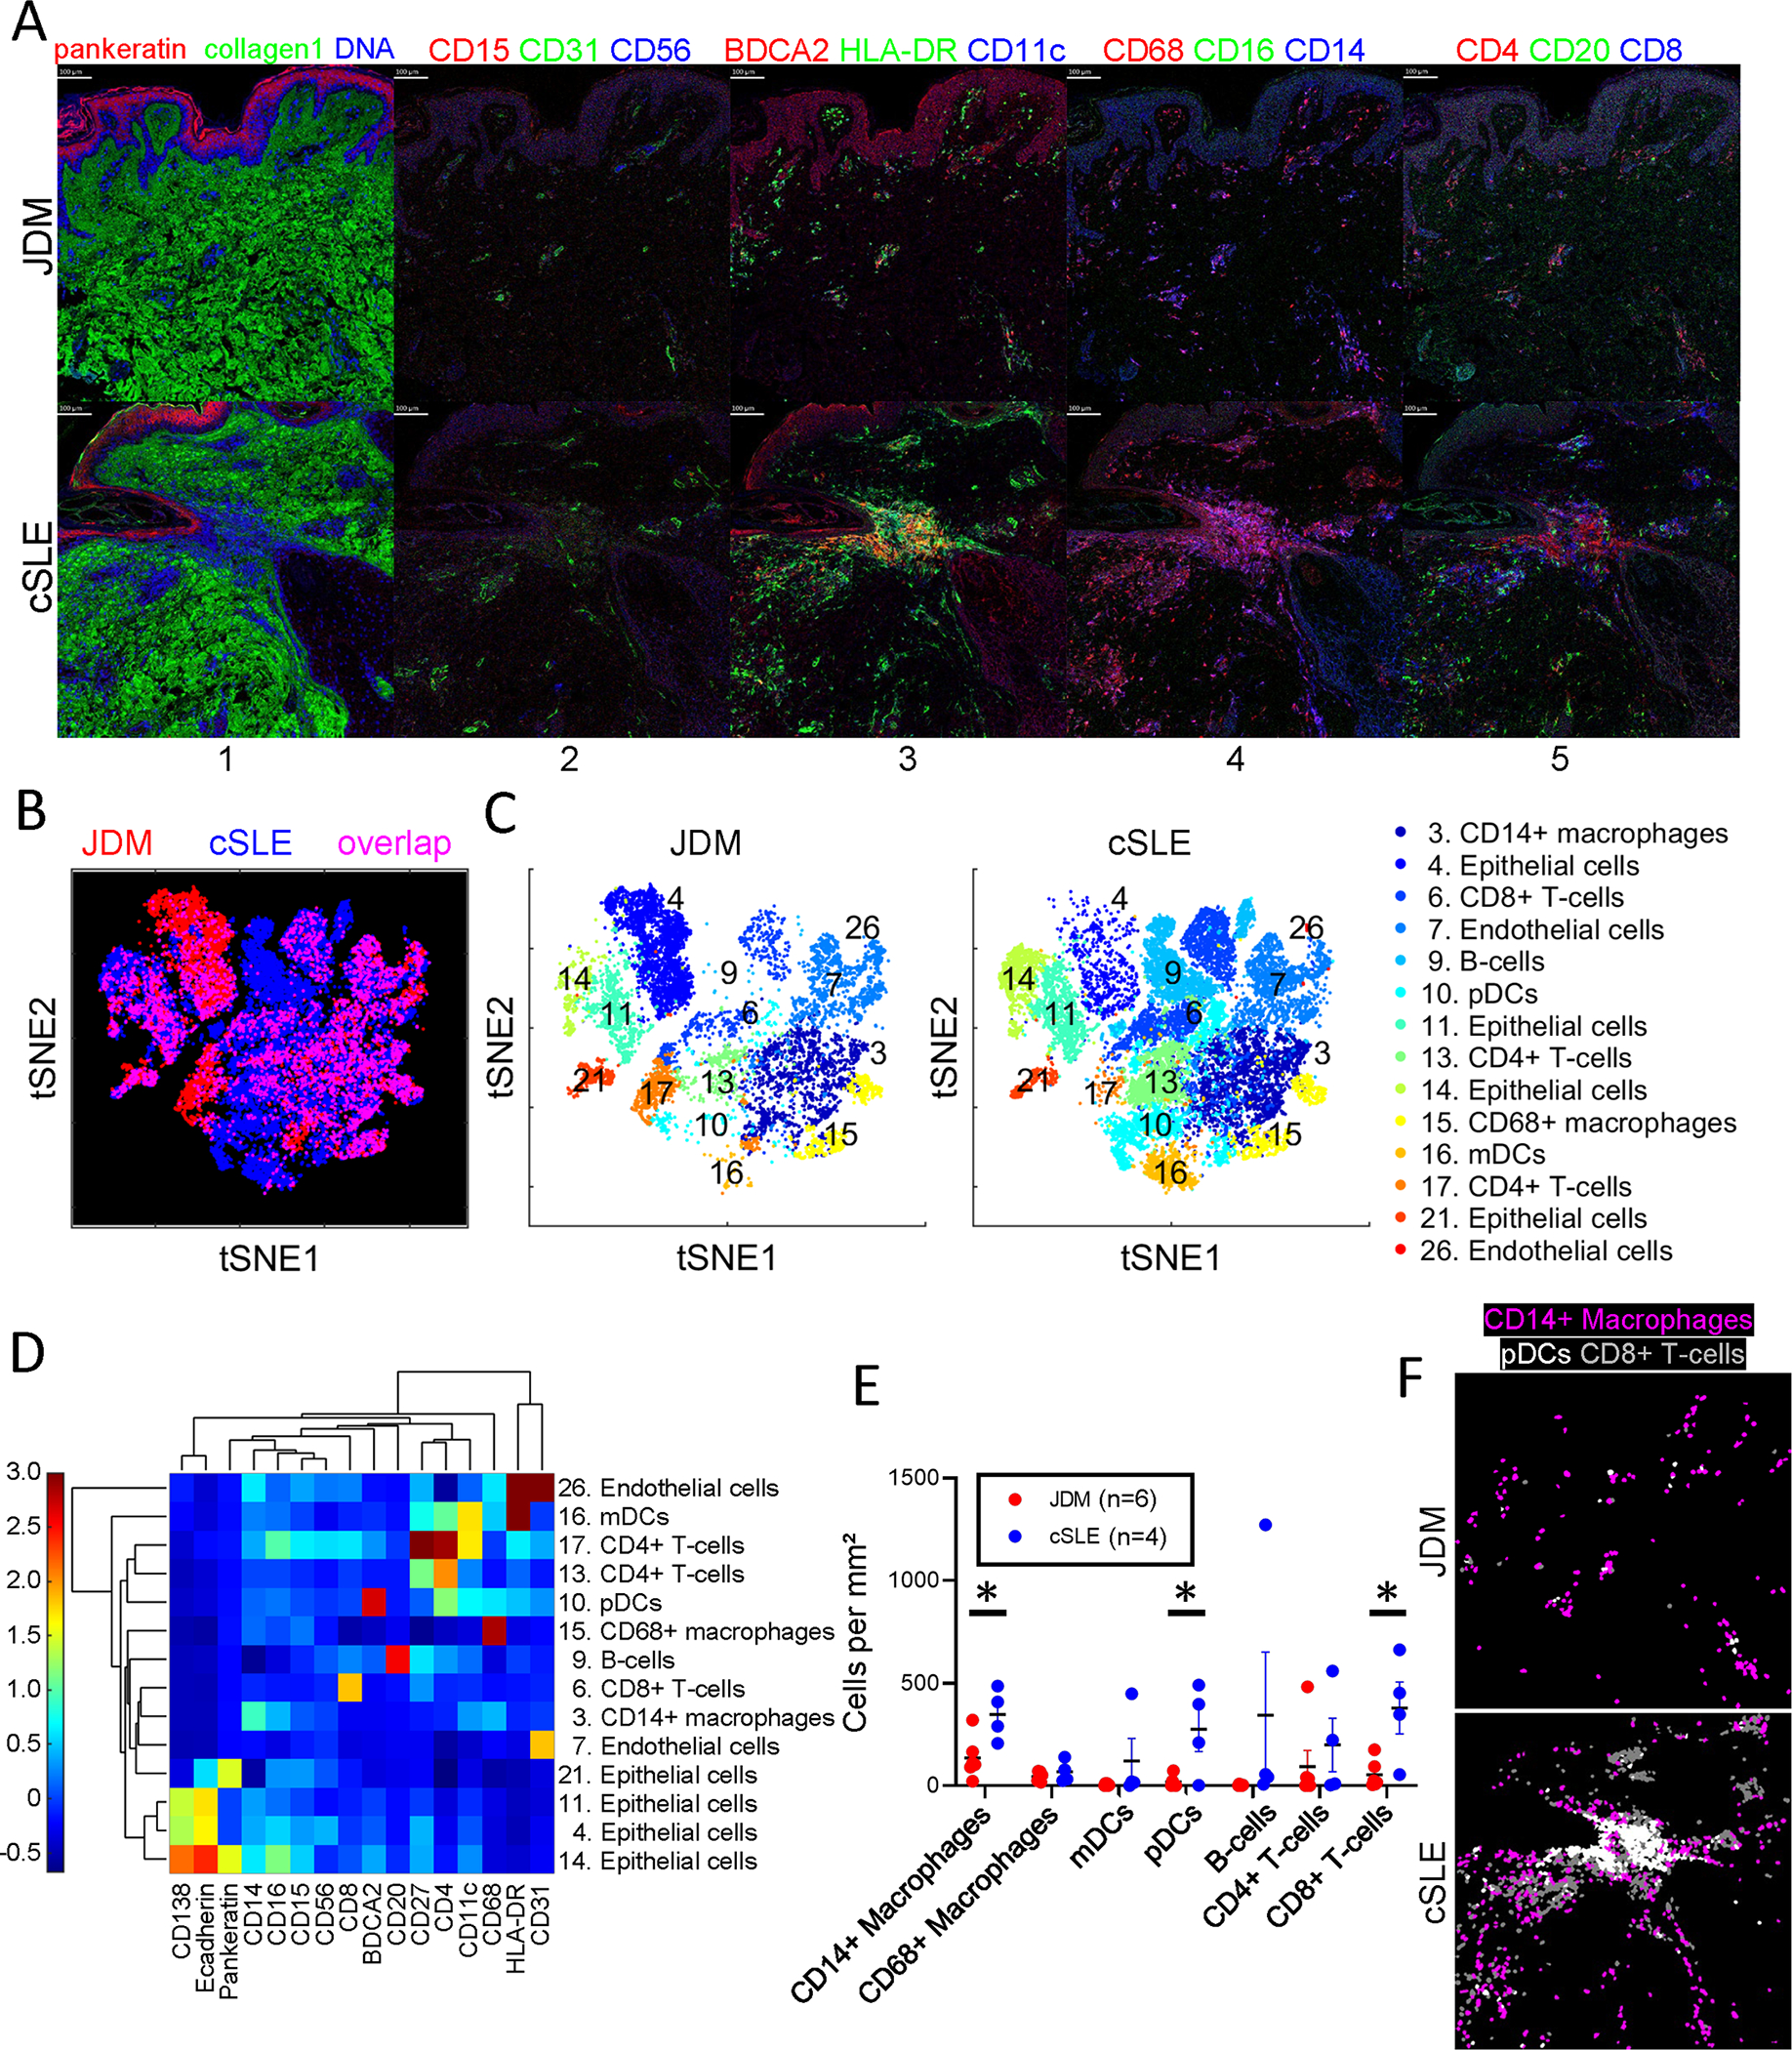
Figure 1. CD14+ macrophages, plasmacytoid dendritic cells and CD8+ T-cells are increased in cSLE as compared to JDM lesional skin.

(A) Multiplexed images demonstrating staining for cellular markers in JDM and cSLE skin samples, with colors by panel including (panel 1) pankeratin (red), collagen1 (green), DNA (blue), (panel 2) CD15 (red), CD31 (green), CD56 (blue), (panel 3) BDCA2 (red), HLA-DR (green), CD11c (blue), (panel 4) CD68 (red), CD16 (green), CD14 (blue) and (panel 5) CD4 (red), CD20 (green), CD8 (blue). Analysis by t-distributed stochastic neighbor embedding (t-SNE) dimensionality reduction demonstrating (B) overlay of identified JDM and cSLE cell clusters and (C) individual tSNE plots by disease. (D) Phenograph clustergram and heatmap showing marker expression by cell cluster. (E) Quantification of immune cell types per disease based on marker expression. (F) Representative images demonstrating higher quantities of CD14+ macrophages (purple), pDCs (white) and CD8+ T-cells (gray) in cSLE as compared to JDM.
