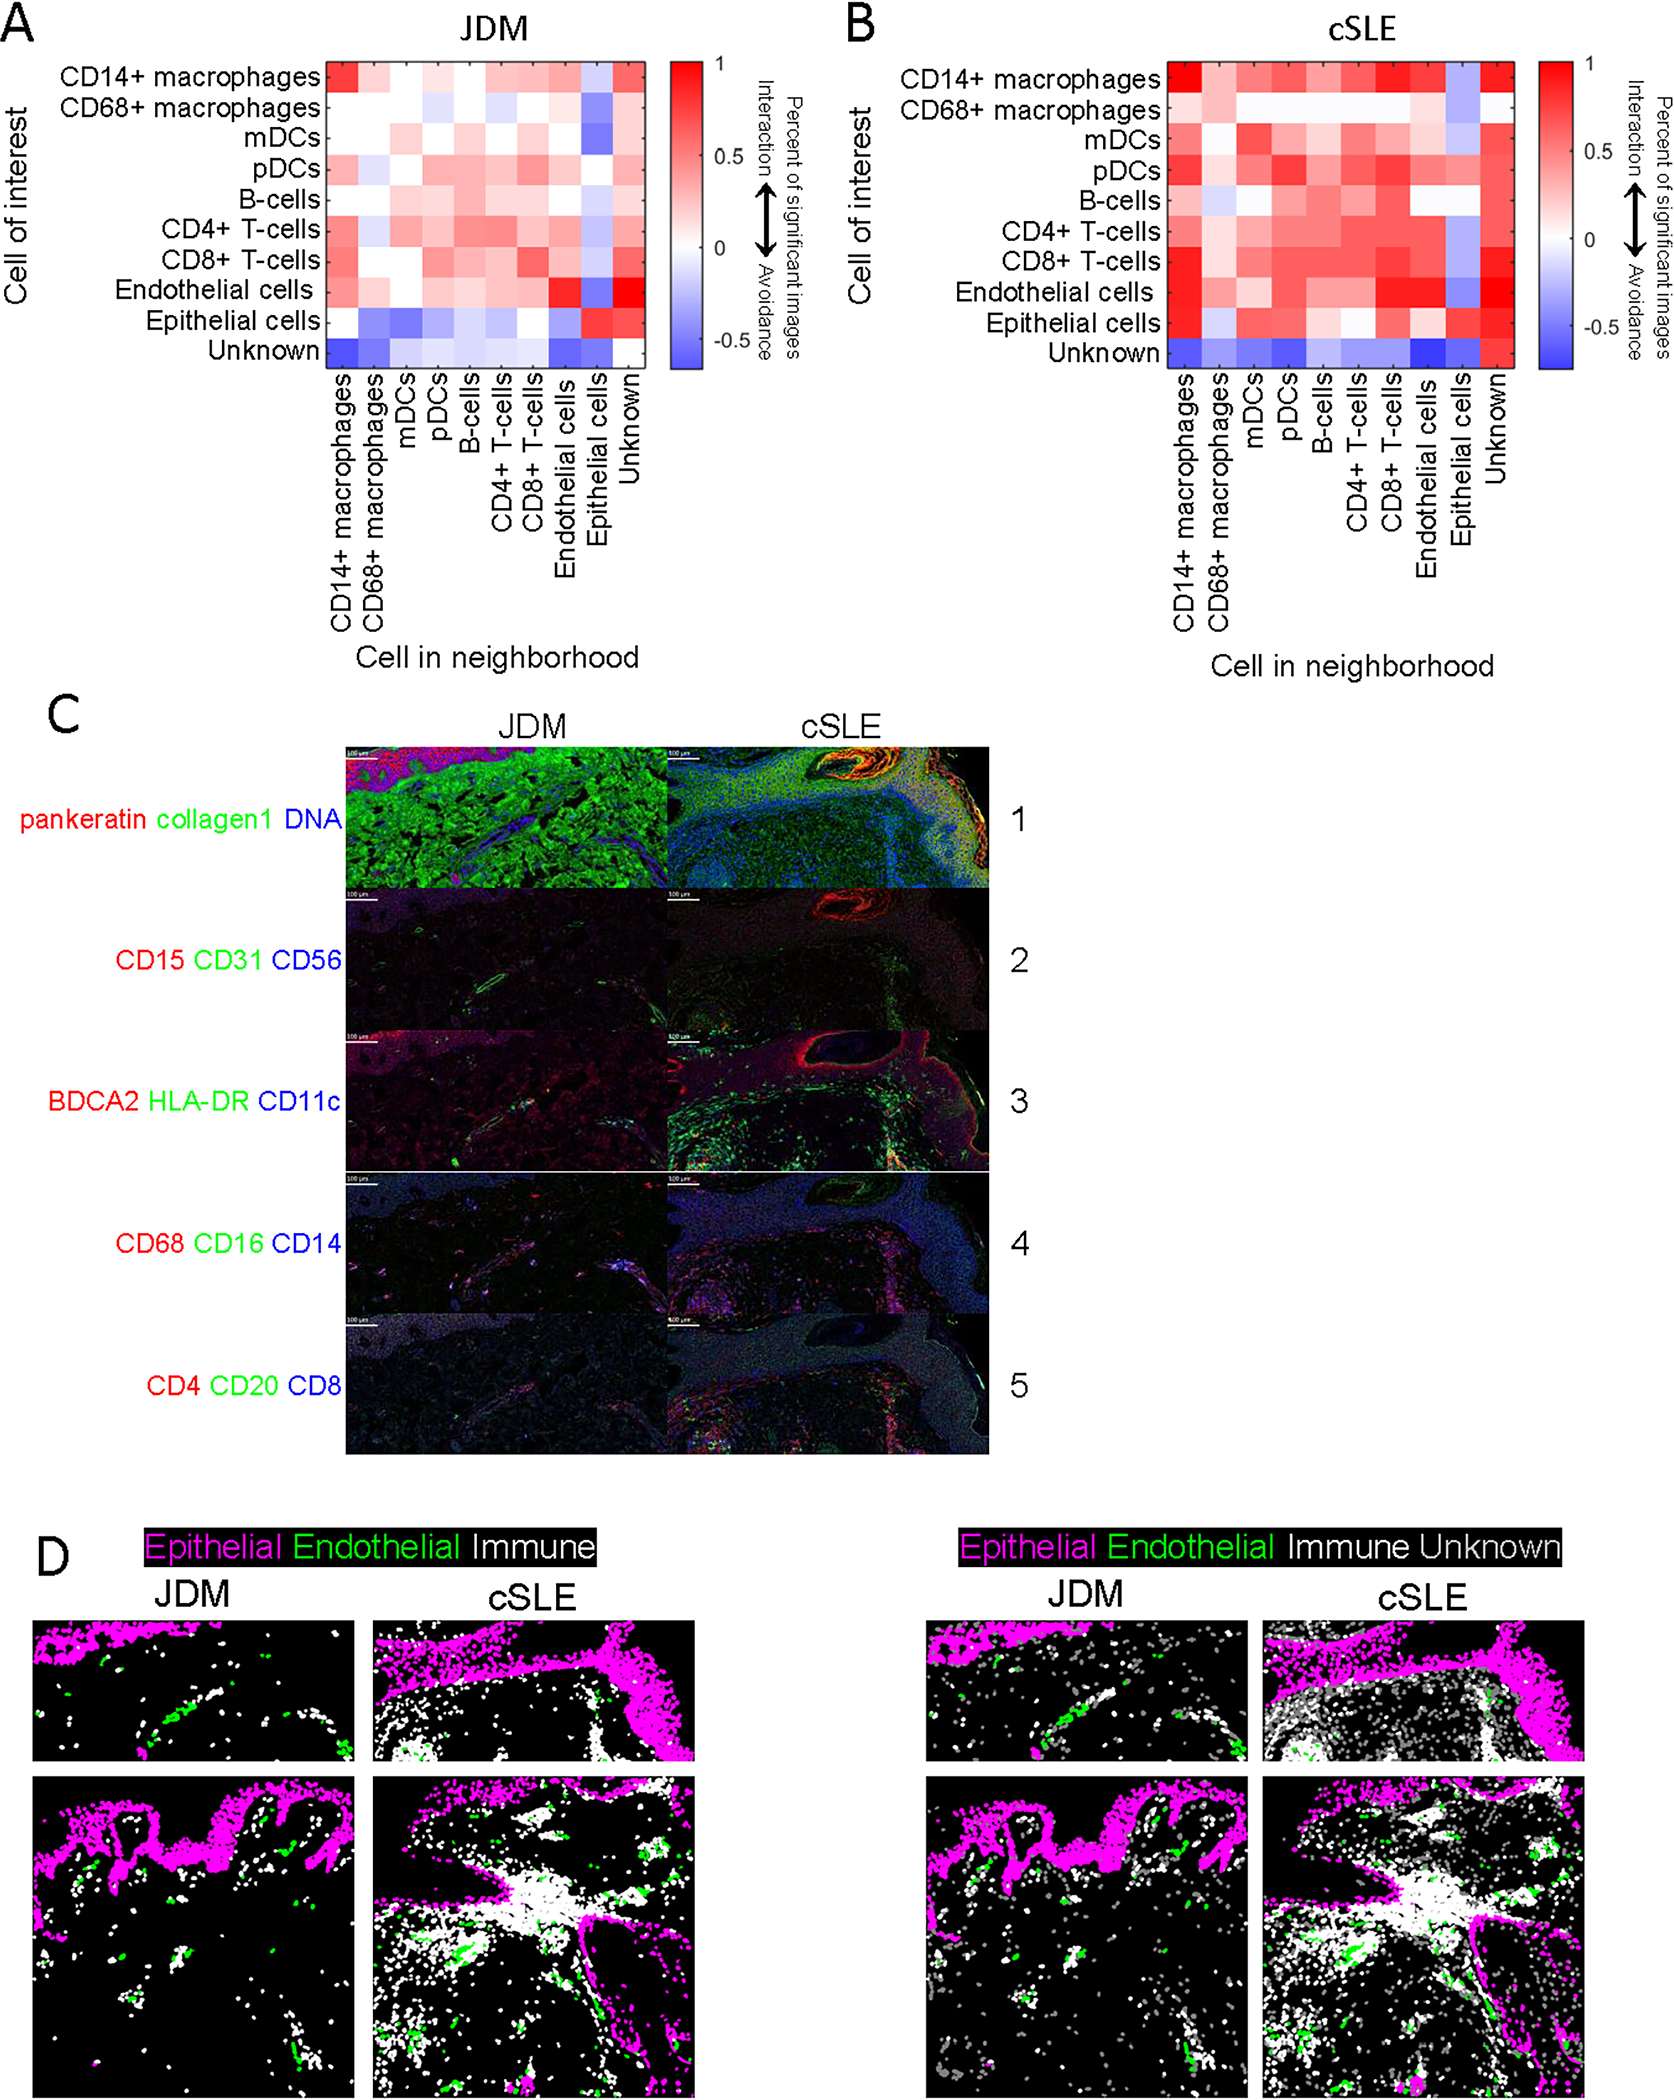
Figure 3. Cell-cell interactions in lesional JDM and cSLE skin using neighborhood analysis.

Heatmaps highlighting differences in cell-cell interactions in (A) JDM and (B) cSLE lesional skin using permutation tests for neighborhood analysis. Red represents a positive association (p<0.01), white represents an insignificant association and blue represents a negative association (p<0.01). (C) Multiplexed images demonstrating staining for cellular markers in JDM and cSLE skin samples, with colors by panel including (panel 1) pankeratin (red), collagen1 (green), DNA (blue), (panel 2) CD15 (red), CD31 (green), CD56 (blue), (panel 3) BDCA2 (red), HLA-DR (green), CD11c (blue), (panel 4) CD68 (red), CD16 (green), CD14 (blue) and (panel 5) CD4 (red), CD20 (green), CD8 (blue). (D) Demonstration of increased epithelial-immune cell interaction in cSLE as compared to JDM and overall more prominent endothelial-immune cell interaction in JDM, with purple identifying epithelial cell marker expression, green = endothelial cell marker expression, white = immune cell marker expression and gray = unknown or unidentified cells.
