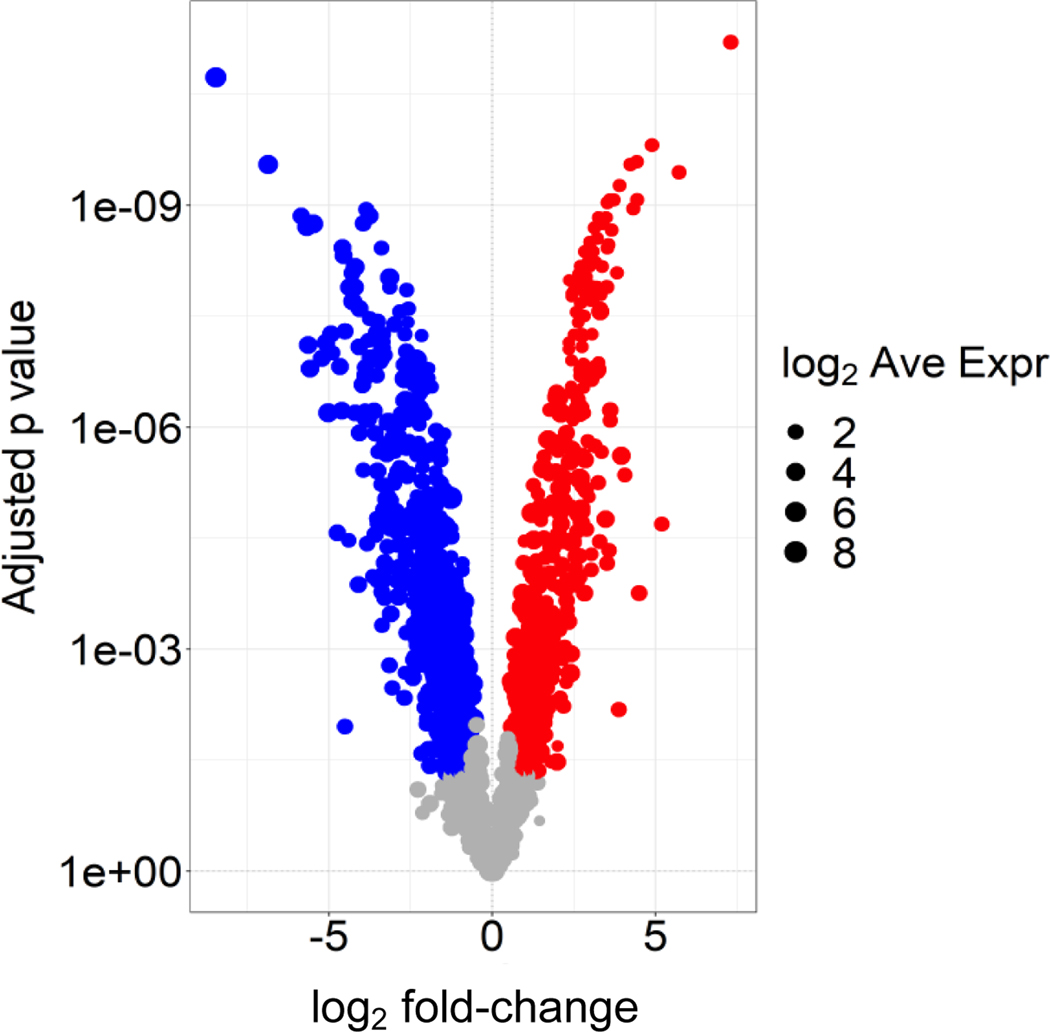
Figure 1. Volcano plot of proteins that differ between exomeres (blue) and supermeres (red).
Exomeres and supermeres derived from DiFi cells were lysed in RIPA buffer and equal amounts of protein were run on a NuPAGE bis-Tris gel. LC-MS/MS was performed as described in Methods Zhang et al. 2021. Spectral counts of proteins were normalized to total spectral counts and log2-transformed. Shown are proteins that differ by 1.5-fold or greater by spectral counts with a false discovery rate of 0.05.

