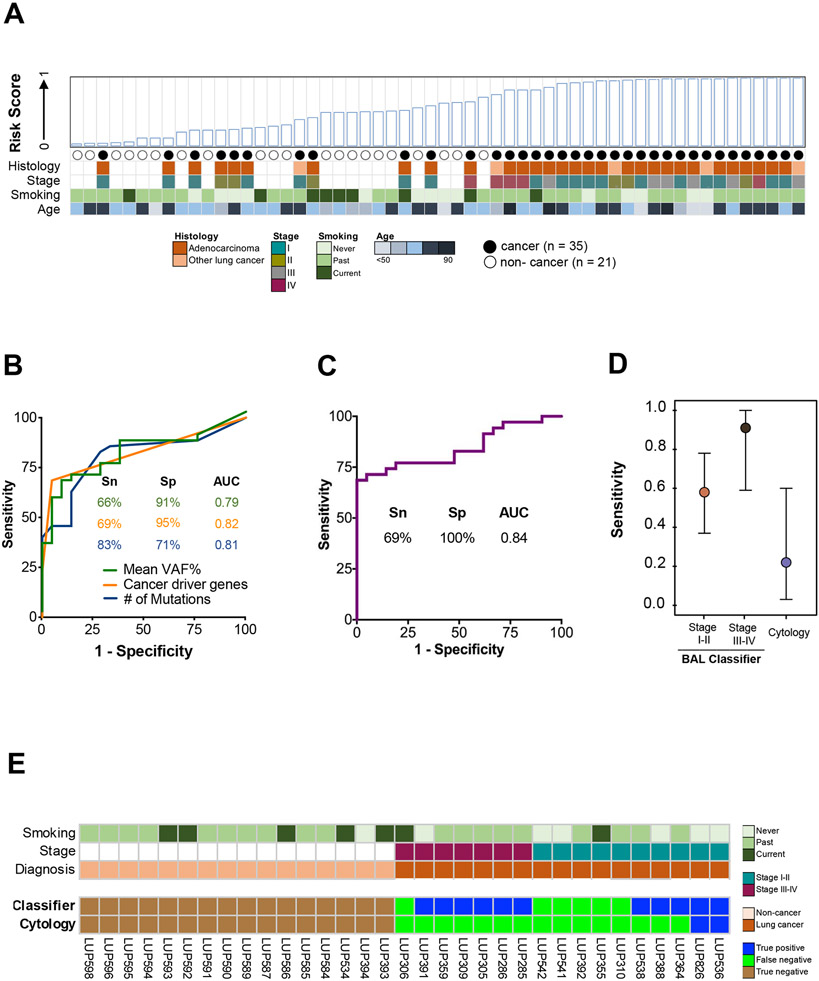
Figure 4. Derivation and performance of a BAL cfDNA genomic classifier for lung cancer diagnosis.
(A) BAL risk score based on eleven genomic features (Supplemental Table 9; see methods). Case-control status and relevant clinico-pathologic variables are indicated. NSCLC = Non-small cell lung cancer.
(B) Individual performance of the top three features contributing to the BAL cfDNA classifier at the optimal cut point (Youden’s value). Mean VAF% (green line), cancer driver genes (orange line), and number of mutations (blue line). Sn = Sensitivity. Sp = Specificity. AUC = Area under the curve.
(C) Performance of the BAL cfDNA classifier using all eleven features at the optimal cut point (Supplemental Table 9). Sp = Specificity. AUC = Area under the curve.
(D) Sensitivity of the BAL genomic classifier and BAL cytology at a specificity of 100% for diagnosing lung cancer stratified by stage. Point estimates are represented by a circle and 95% confidence intervals by whiskers. Analysis based on 17 cancer patients and 16 controls who had both cytology and BAL genomics scores available.
(E) Patient level comparison of BAL cytology and BAL genomic classifier risk scores using a 100% specificity threshold. Seventeen cancer patients and 16 non-cancer patients that had both cytology and a risk score assigned to them are arranged on the x-axis by stage and cancer status.

