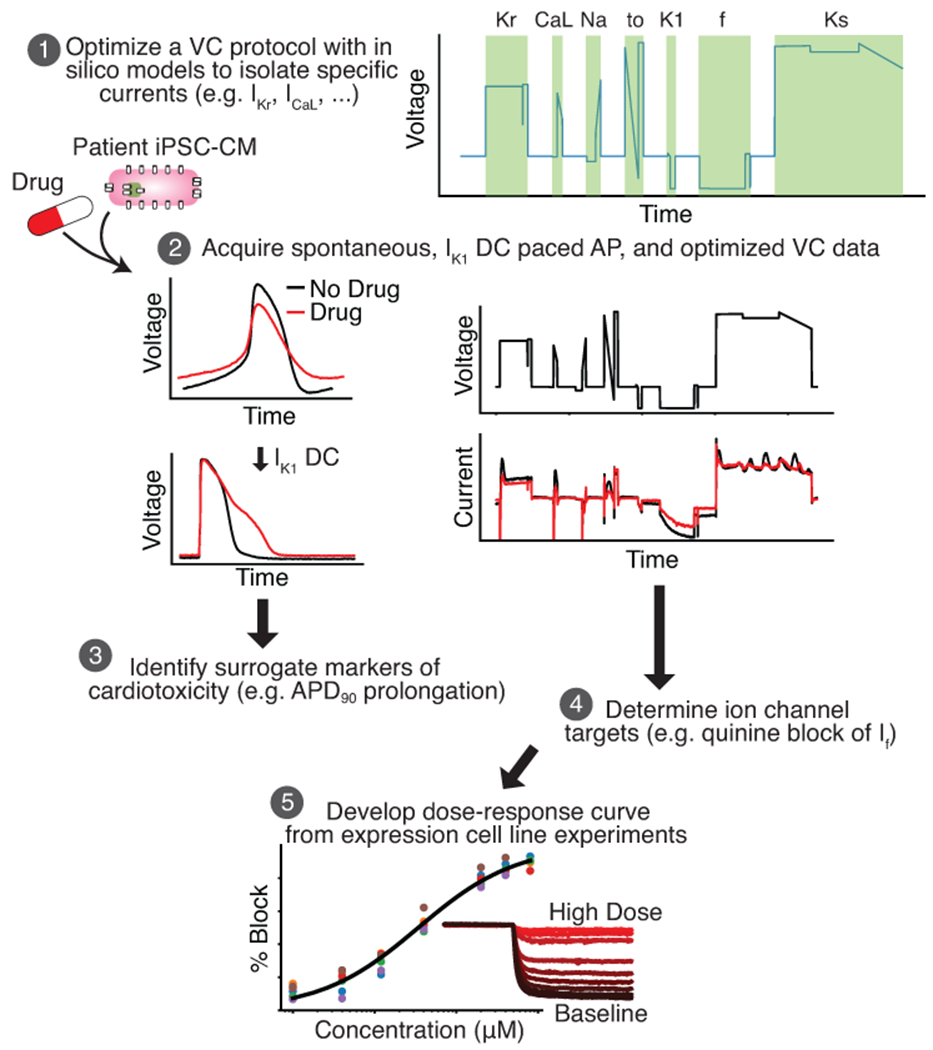
Figure 1: An in silico-in vitro pipeline to determine drug cardiotoxicity risk and mechanism.

Step 1, The Kernik-Clancy model with experimental artifacts is used to develop a VC protocol that is specifically designed to isolate currents. Step 2, Spontaneous, IK1 dynamic clamp and paced AP, and optimized VC data is acquired from a patient-derived iPSC-CM before and after drug application. Step 3, The change in IK1 dynamic clamp and paced AP data from pre- to post-drug application is used to identify AP prolongation, a surrogate marker of cardiotoxicity. Step 4, Changes in VC data is used to determine the ion channels targeted by a drug. Step 5, After identifying the ion channel targeted by a drug, a dose-response curve is developed for each of these ion channels using expression line cells.
