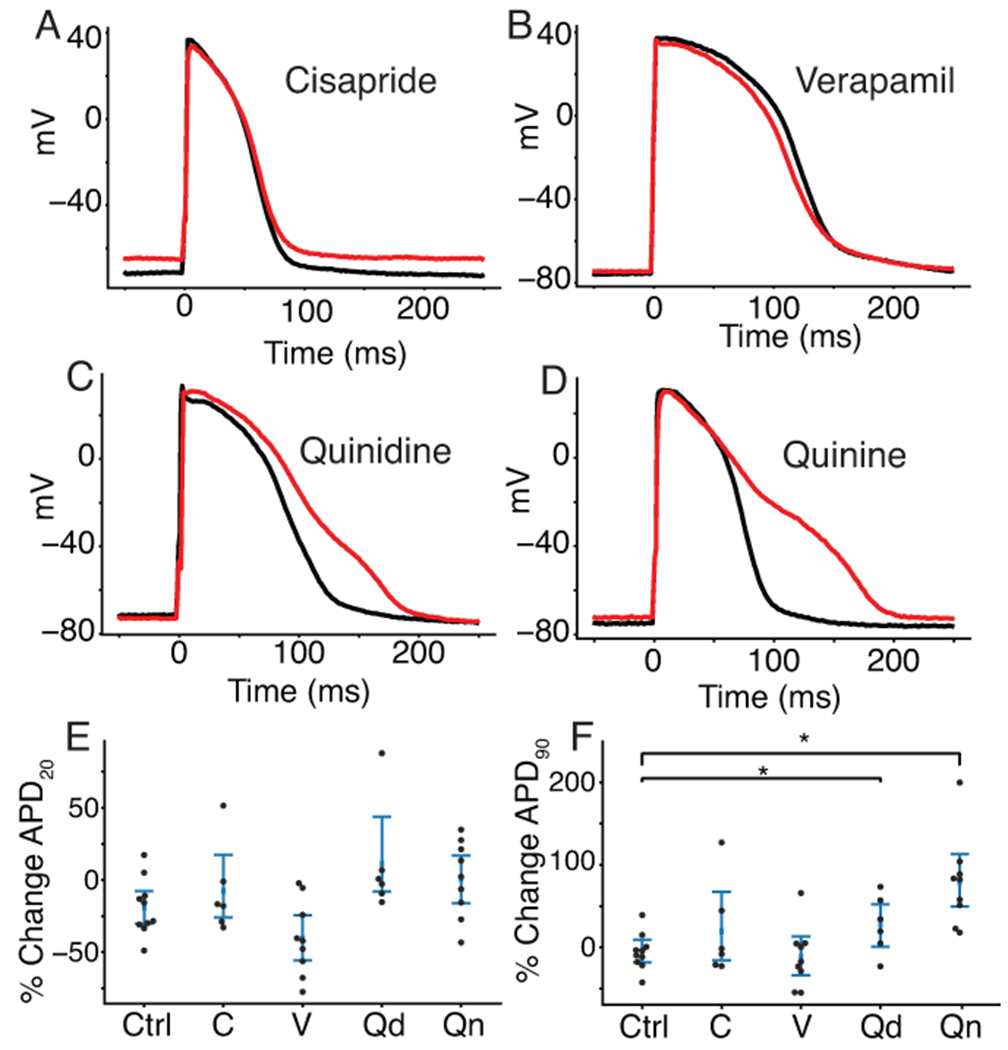
Figure 4. Drug treatment resulted in AP morphology changes consistent with the effects caused by drug block of the expected currents.

Four cells with dynamically clamped IK1 and paced at 1Hz before (black) and after (red) treatment with cisapride (A), verapamil (B), quinidine (C), and quinine (D). E, Percent change in APD20 and (F) APD90 for drugs treated with cisapride (labeled C), verapamil (V), quinidine (Qd), quinine (Qn) or a DMSO control solution (Ctrl). No drugs caused a significant change in APD20 compared to control cells. Quinidine (p=.034) and quinine (Qn, p=.0003) showed significant prolongation when compared to control cells.
