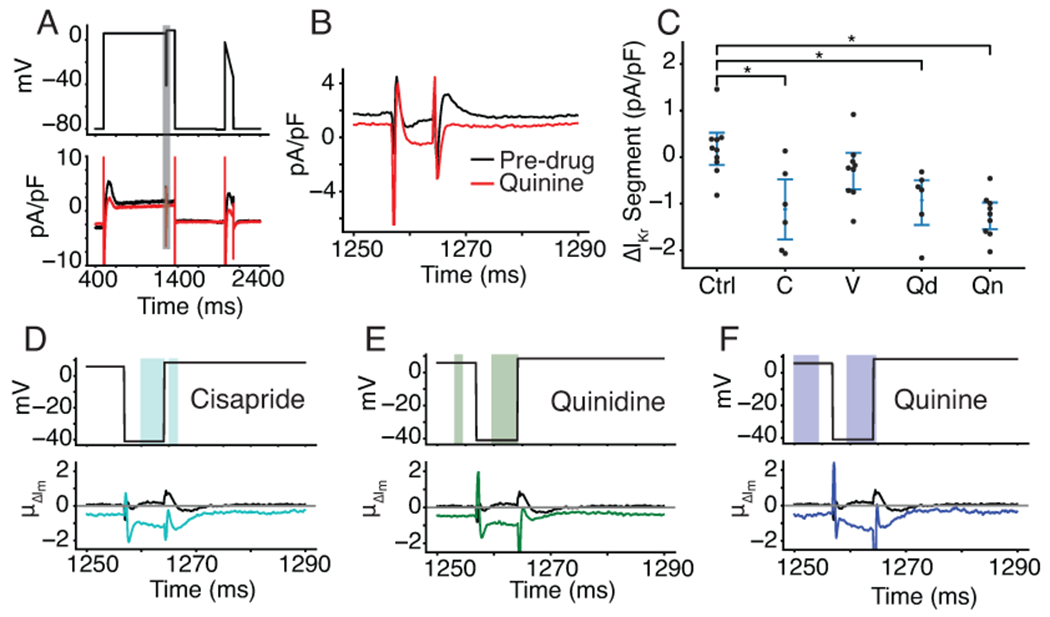
Figure 5. Optimized VC protocol correctly identifies IKr as a target of cisapride, quinidine, and quinine.

A, Representative cell shows the effect of quinine on the current response during the segment of the VC protocol designed to isolate IKr. The black trace is pre-drug and the red trace is post-drug. B, the current trace during the segment meant to isolate IKr (shaded grey in panel A). C, Cells treated with cisapride (labeled C, p=.0032), quinidine (labeled Qd, p=.0041), and quinine (labeled Qn, p=.00002) show a decrease in total current during the VC segment designed to isolate IKr. At the concentrations used in this experiment, cisapride, quinidine, and quinine should block 95%, 89%, and 72% of IKr, respectively. D, E, and F, Functional t-tests show a significant difference in the average change in current during the IKr-isolating segment when comparing cells treated with DMSO to cells treated with cisapride (D), quinidine (E), and quinine (F). Verapamil was excluded because there was no significant difference during this segment of the protocol.
