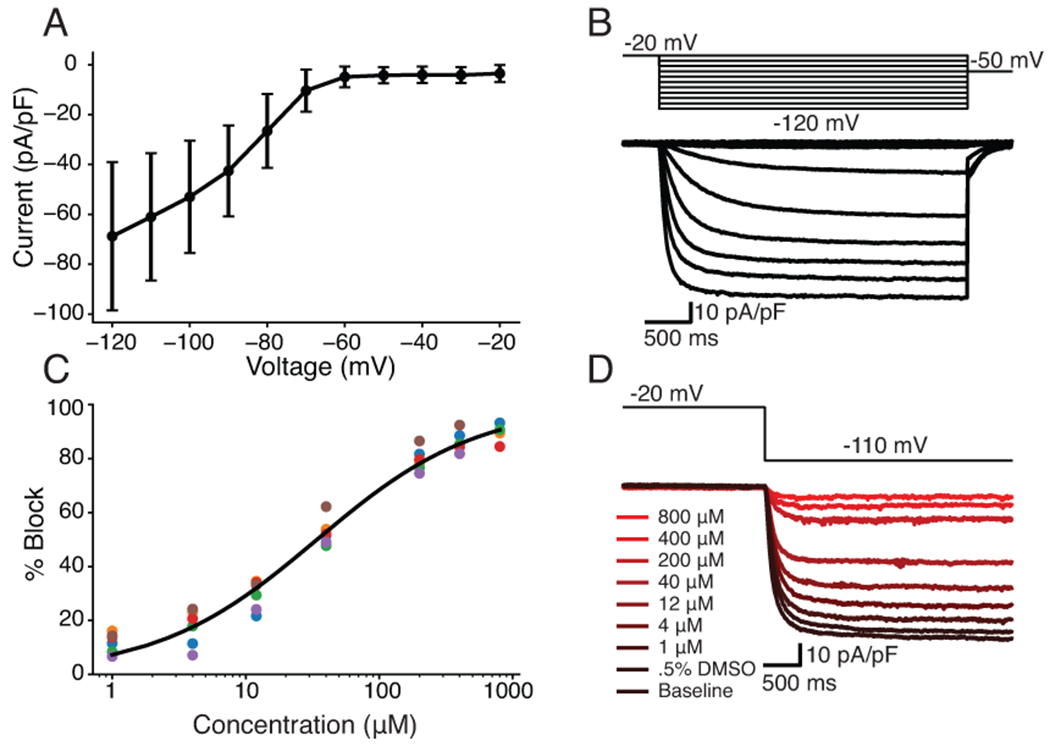
Figure 7: Dose-response curve shows quinine block of funny current in HEK-293 cells stably expressing HCN1.

A, IV curve with averages and errors calculated from six HEK-HCN1 cells. B, Representative HEK-HCN1 current-voltage traces. C, Dose-response curve fit to pharmacology data from six HEK-HCN1 cells. D, Traces generated from a representative cell by clamping at −20mV for 3000ms, and then stepping to −110mV for 3500ms at all tested concentrations.
