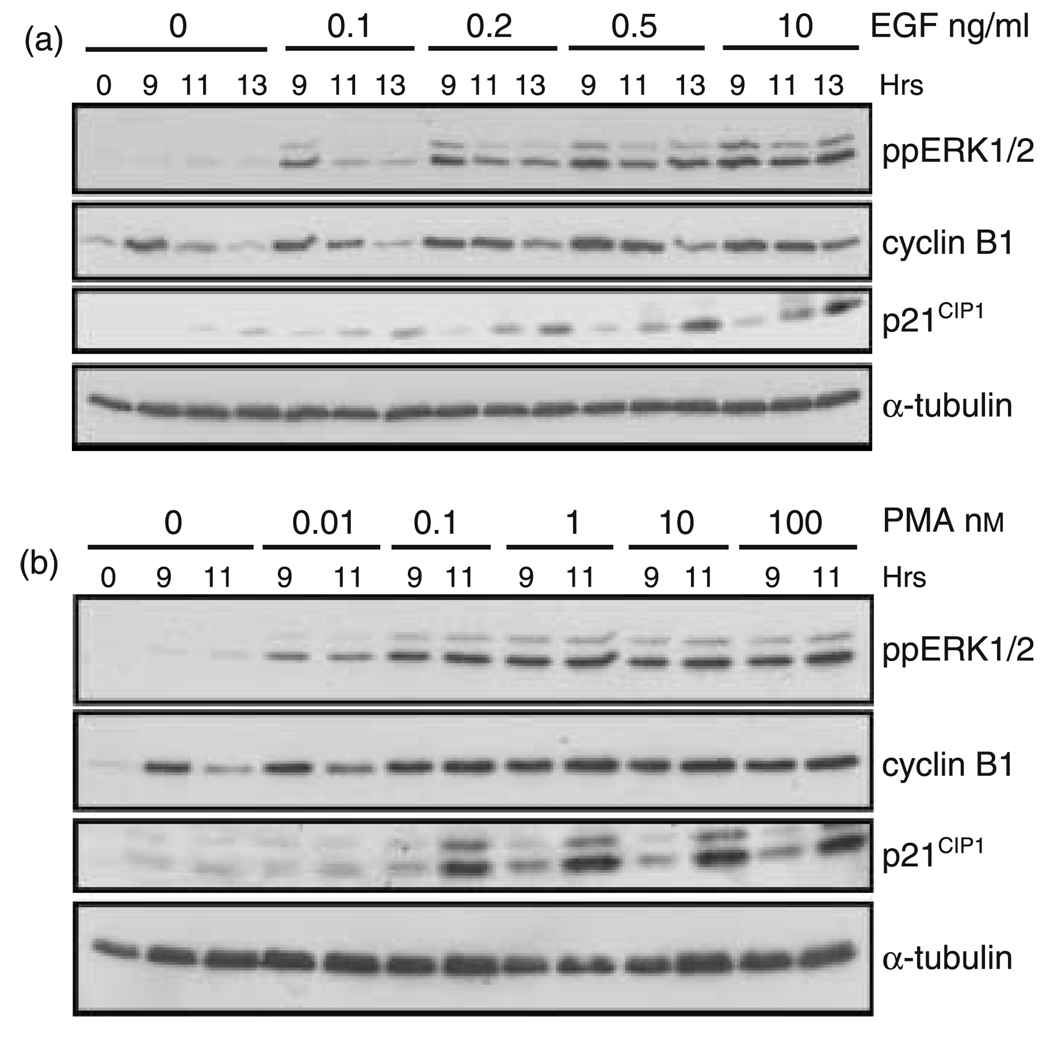
Figure 7. Cyclin B1 and p21CIP1 expression during G2/M-phase correlate with ERK activity.
Cells synchronized in G1/S were released back into the cell cycle and treated with the indicated dose of EGF (a) or PMA (b). Immunoblot analysis shows the level of ppERK1/2 (top panel), cyclin B1, and p21CIP1 (middle panels) expression. The expression of α-tubulin (lower panel) is shown for a protein loading control.

