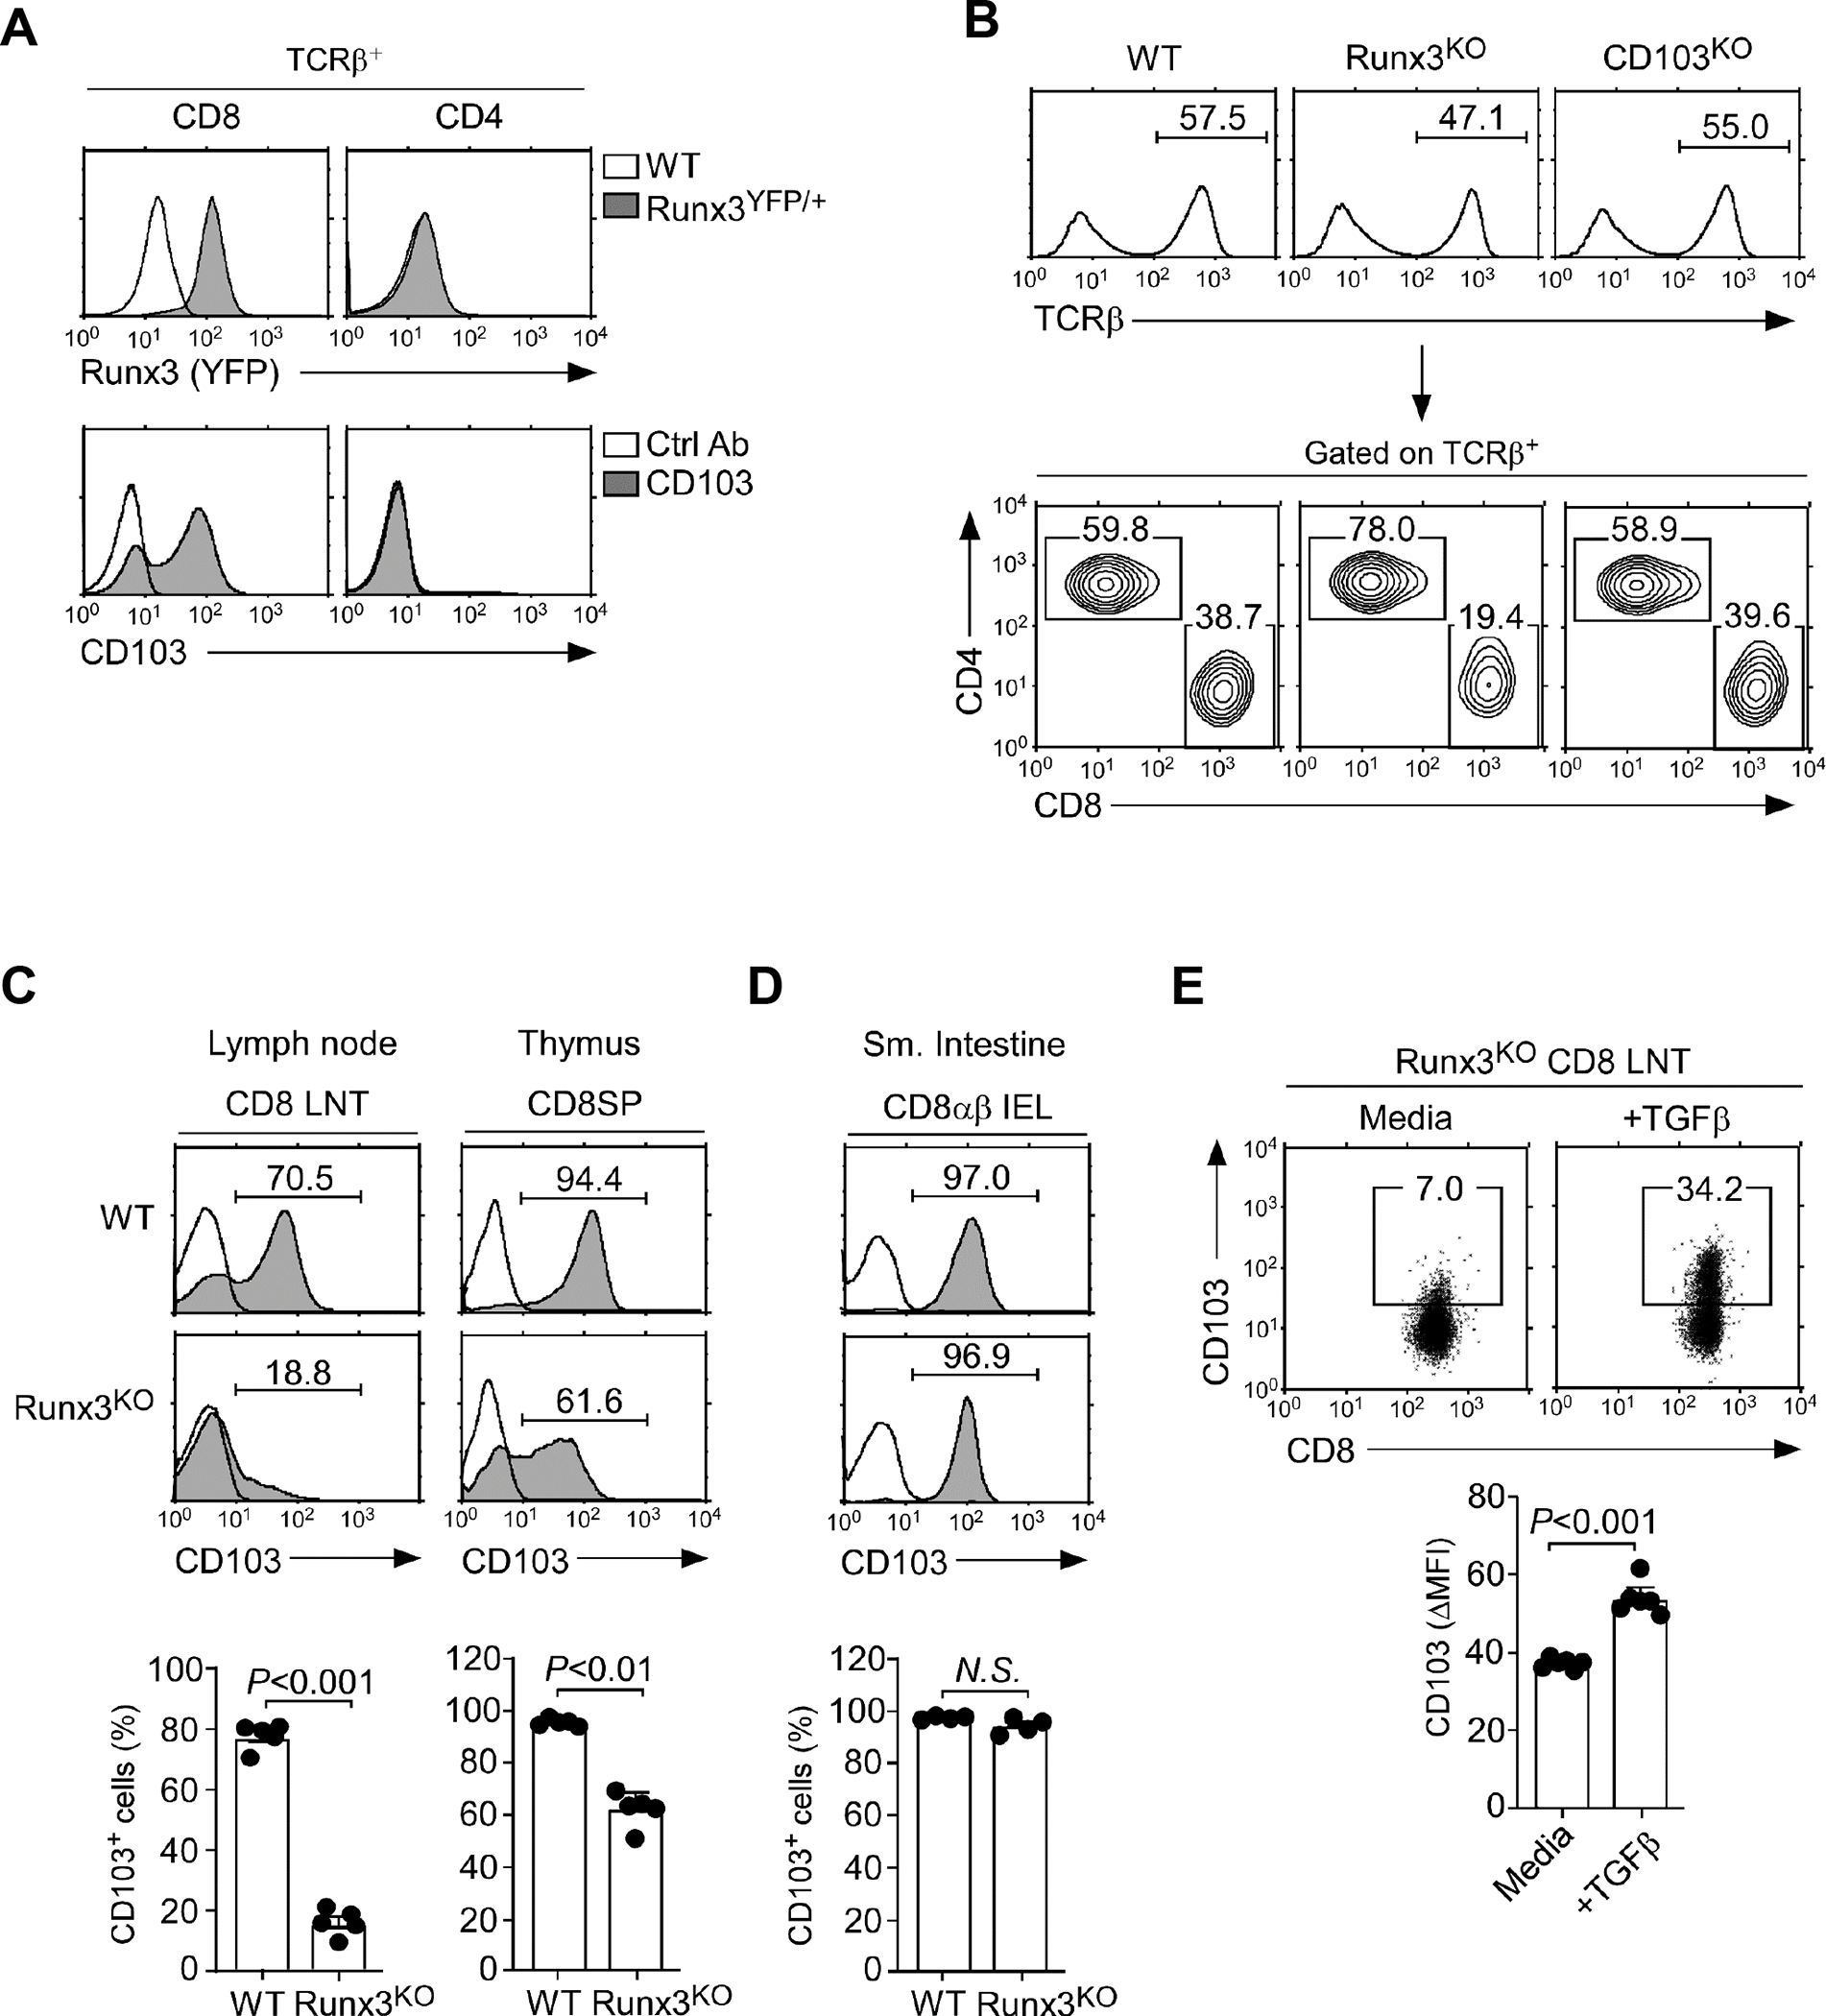
Figure 1. Runx3 is associated with but not required for CD103 expression on CD8 T cells.

(A) Runx3 gene reporter (top) and surface CD103 expression (bottom) in CD8 and CD4 LN T cells of Runx3YFP/+ and WT mice, respectively. The results are representative of at least 3 independent experiments with a total of 5 WT and 3 Runx3YFP/+ mice.
(B) CD8 versus CD4 profiles in LN T cells in WT, Runx3KO, and CD103KO mice. The results are representative of at least 5 independent experiments with a total of 7 WT, 5 Runx3KO, and 7 CD103KO mice.
(C) Surface CD103 expression on CD8 LN T cells (LNT) and mature CD8SP thymocytes of WT and Runx3KO mice. Histograms show staining of anti-CD103 (shaded) versus isotype control antibody (open). Data are representative (top), and the bar graphs show a summary (bottom) of 5 independent experiments with a total of 5 WT and 5 Runx3KO mice.
(D) Surface CD103 expression on CD8αβ TCRβ+ IELs of WT and Runx3KO mice. Histograms show the staining of anti-CD103 (shaded) versus isotype control antibody (open). Data are representative (top), and the bar graph shows a summary (bottom) of 4 independent experiments (bottom) with a total of 4 WT and 4 Runx3KO mice.
(E) Surface CD103 expression on WT and Runx3KO CD8 LN T cells that were FACS-sorted for CD103-negative cells and then cultured in vitro for 4 days with 5 ng/mL recombinant TGF-β. Dot plots are representative of 2 independent experiments.
