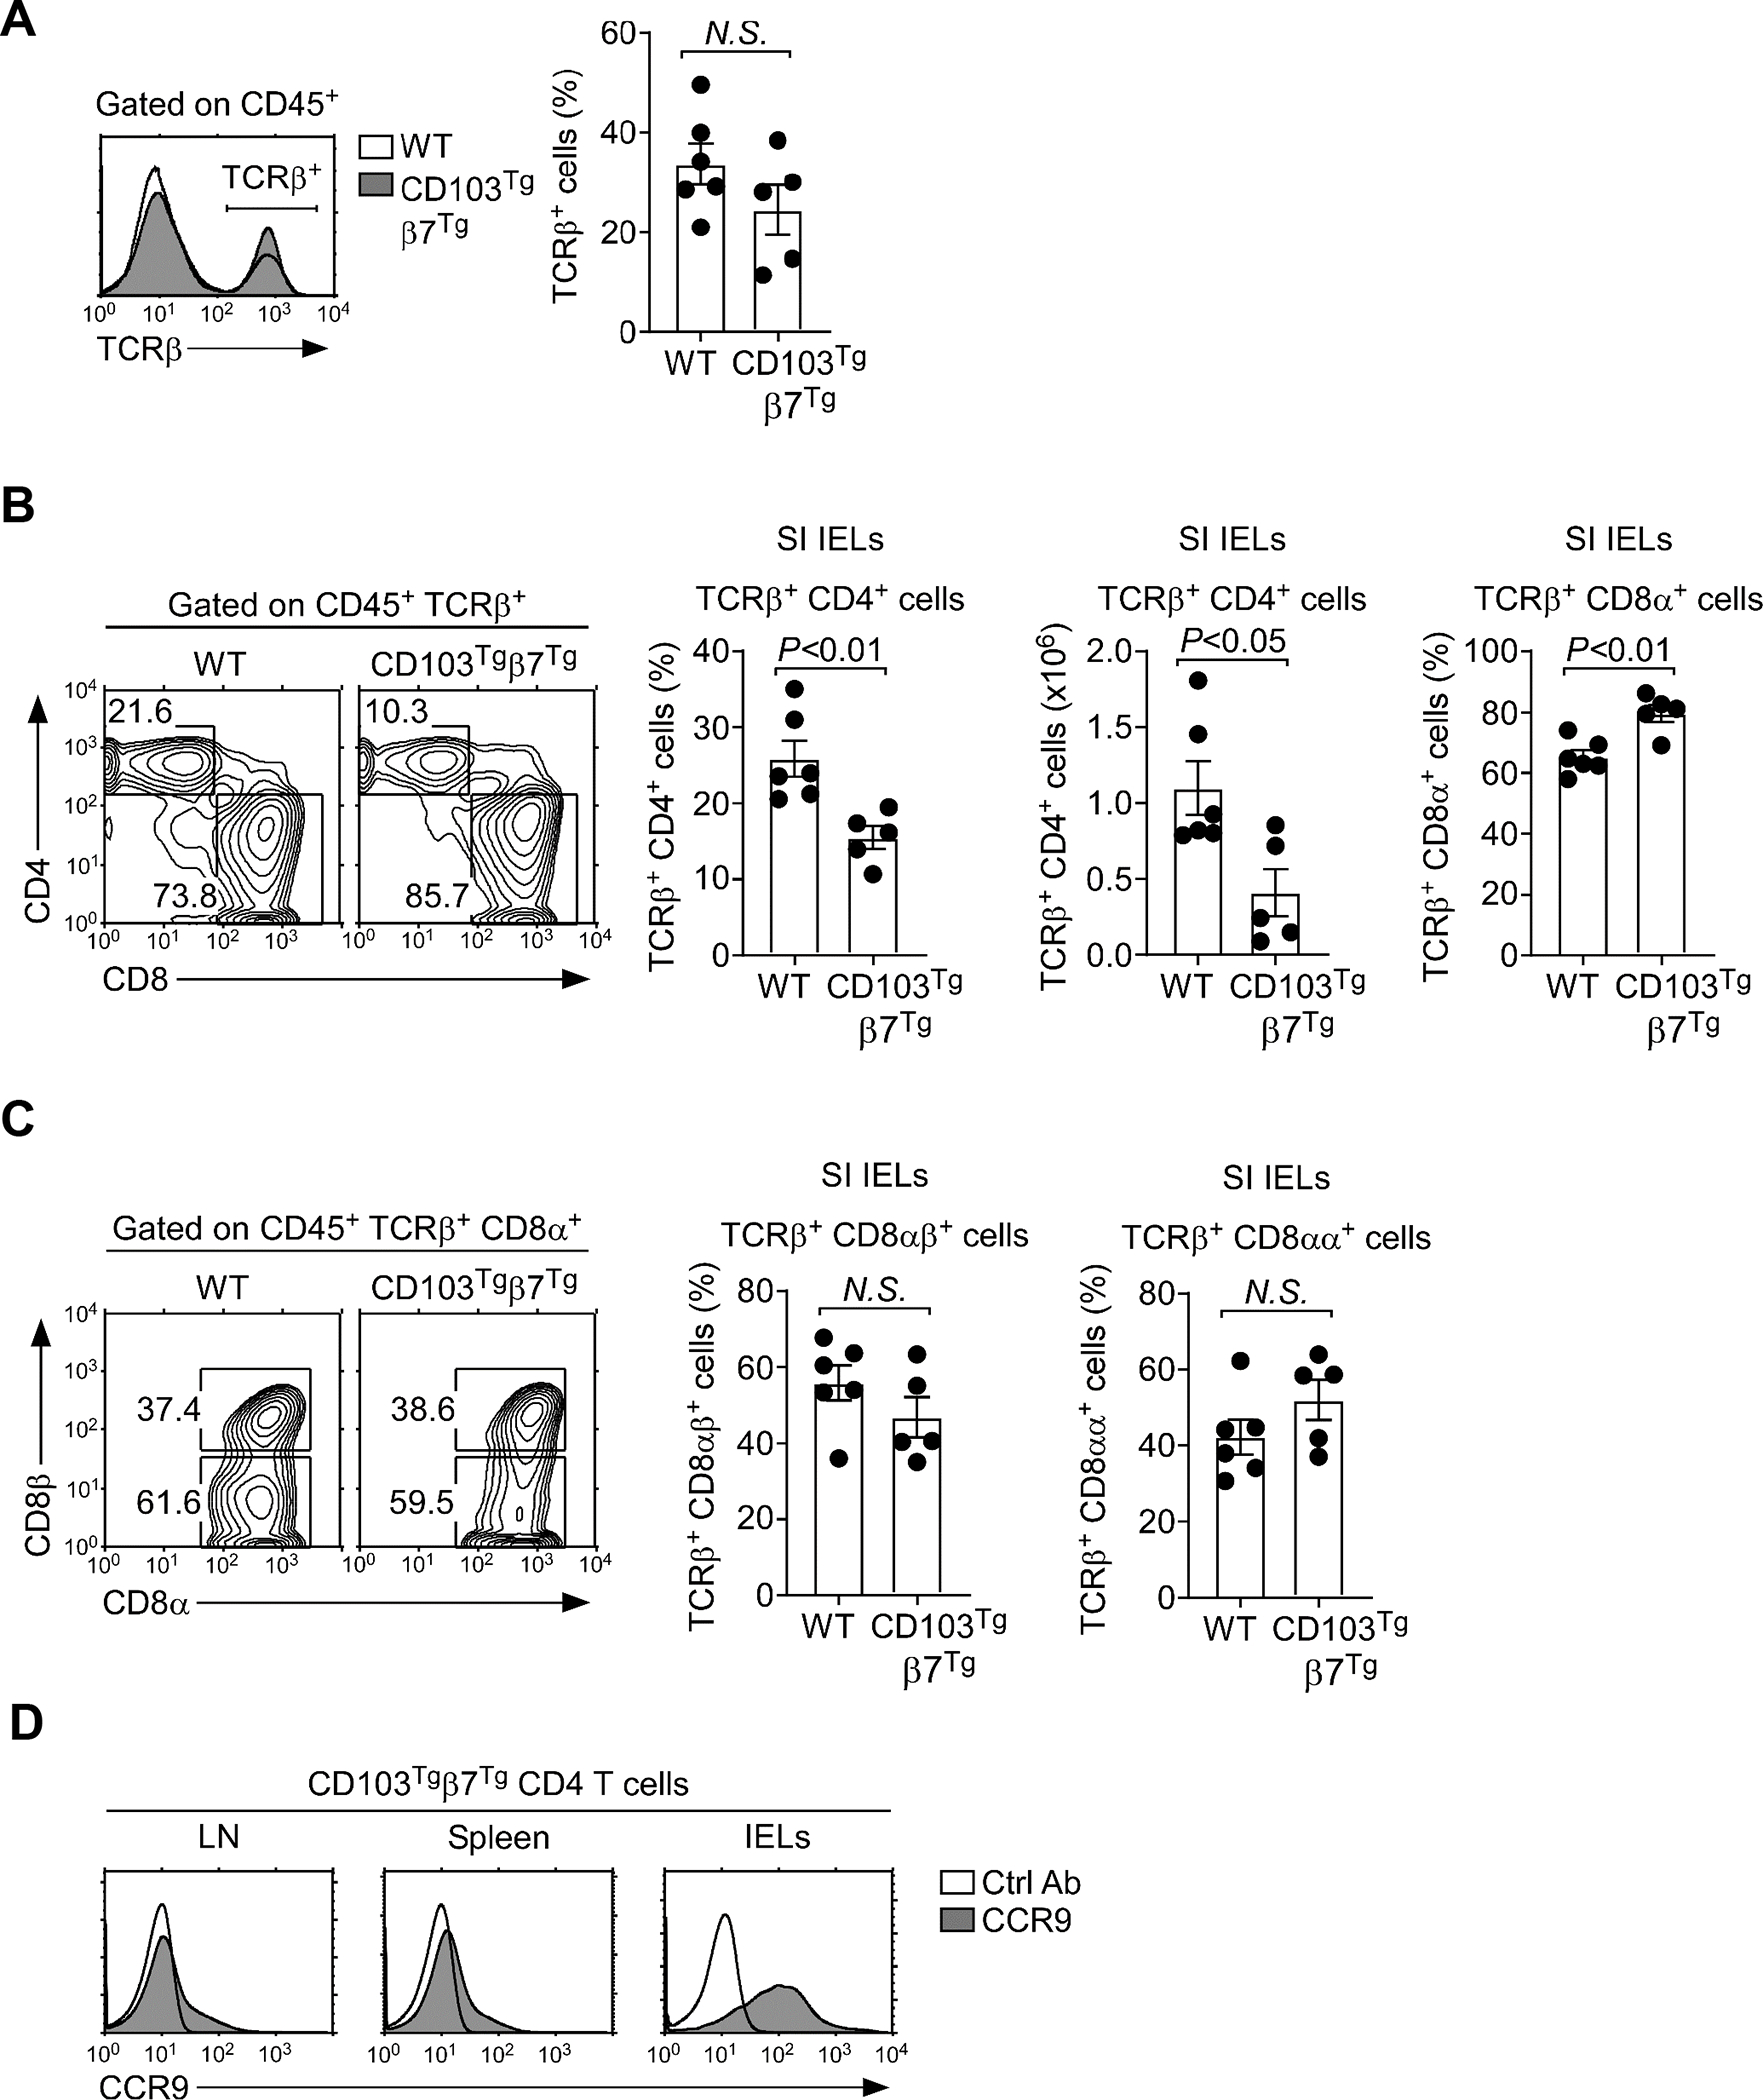
Figure 6. Small intestine CD4+ IELs in CD103Tgβ7Tg mice.

(A) Identification of CD45+-gated αβ T cells in WT and CD103Tgβ7Tg mice (left). Bar graphs show frequencies of αβ T cells among CD45+-gated SI IELs (right). Data are representative of 5 independent experiments with a total of 6 WT and 5 CD103Tgβ7Tg mice.
(B) Contour plots show CD4 versus CD8α profiles of αβ T cells among SI IELs (left). Bar graphs show frequency and number of CD4+ and the frequency of CD8α+ T cells among CD45+ TCRβ+-gated SI IELs in WT and CD103Tgβ7Tg mice (right). Results are the summary of 5 independent experiments with a total of 6 WT and 5 CD103Tgβ7Tg mice.
(C) Frequency of CD8αβ and CD8αα αβ T cells among IELs of WT or CD103Tgβ7Tg mice. Contour plots are representative (left), and bar graphs are a summary of 5 independent experiments with a total of 6 WT and 5 CD103Tgβ7Tg mice.
(D) CCR9 expression on CD4 T cells from spleen, LN, and IELs of CD103Tgβ7Tg mice. The results are representative of 3 independent experiments.
