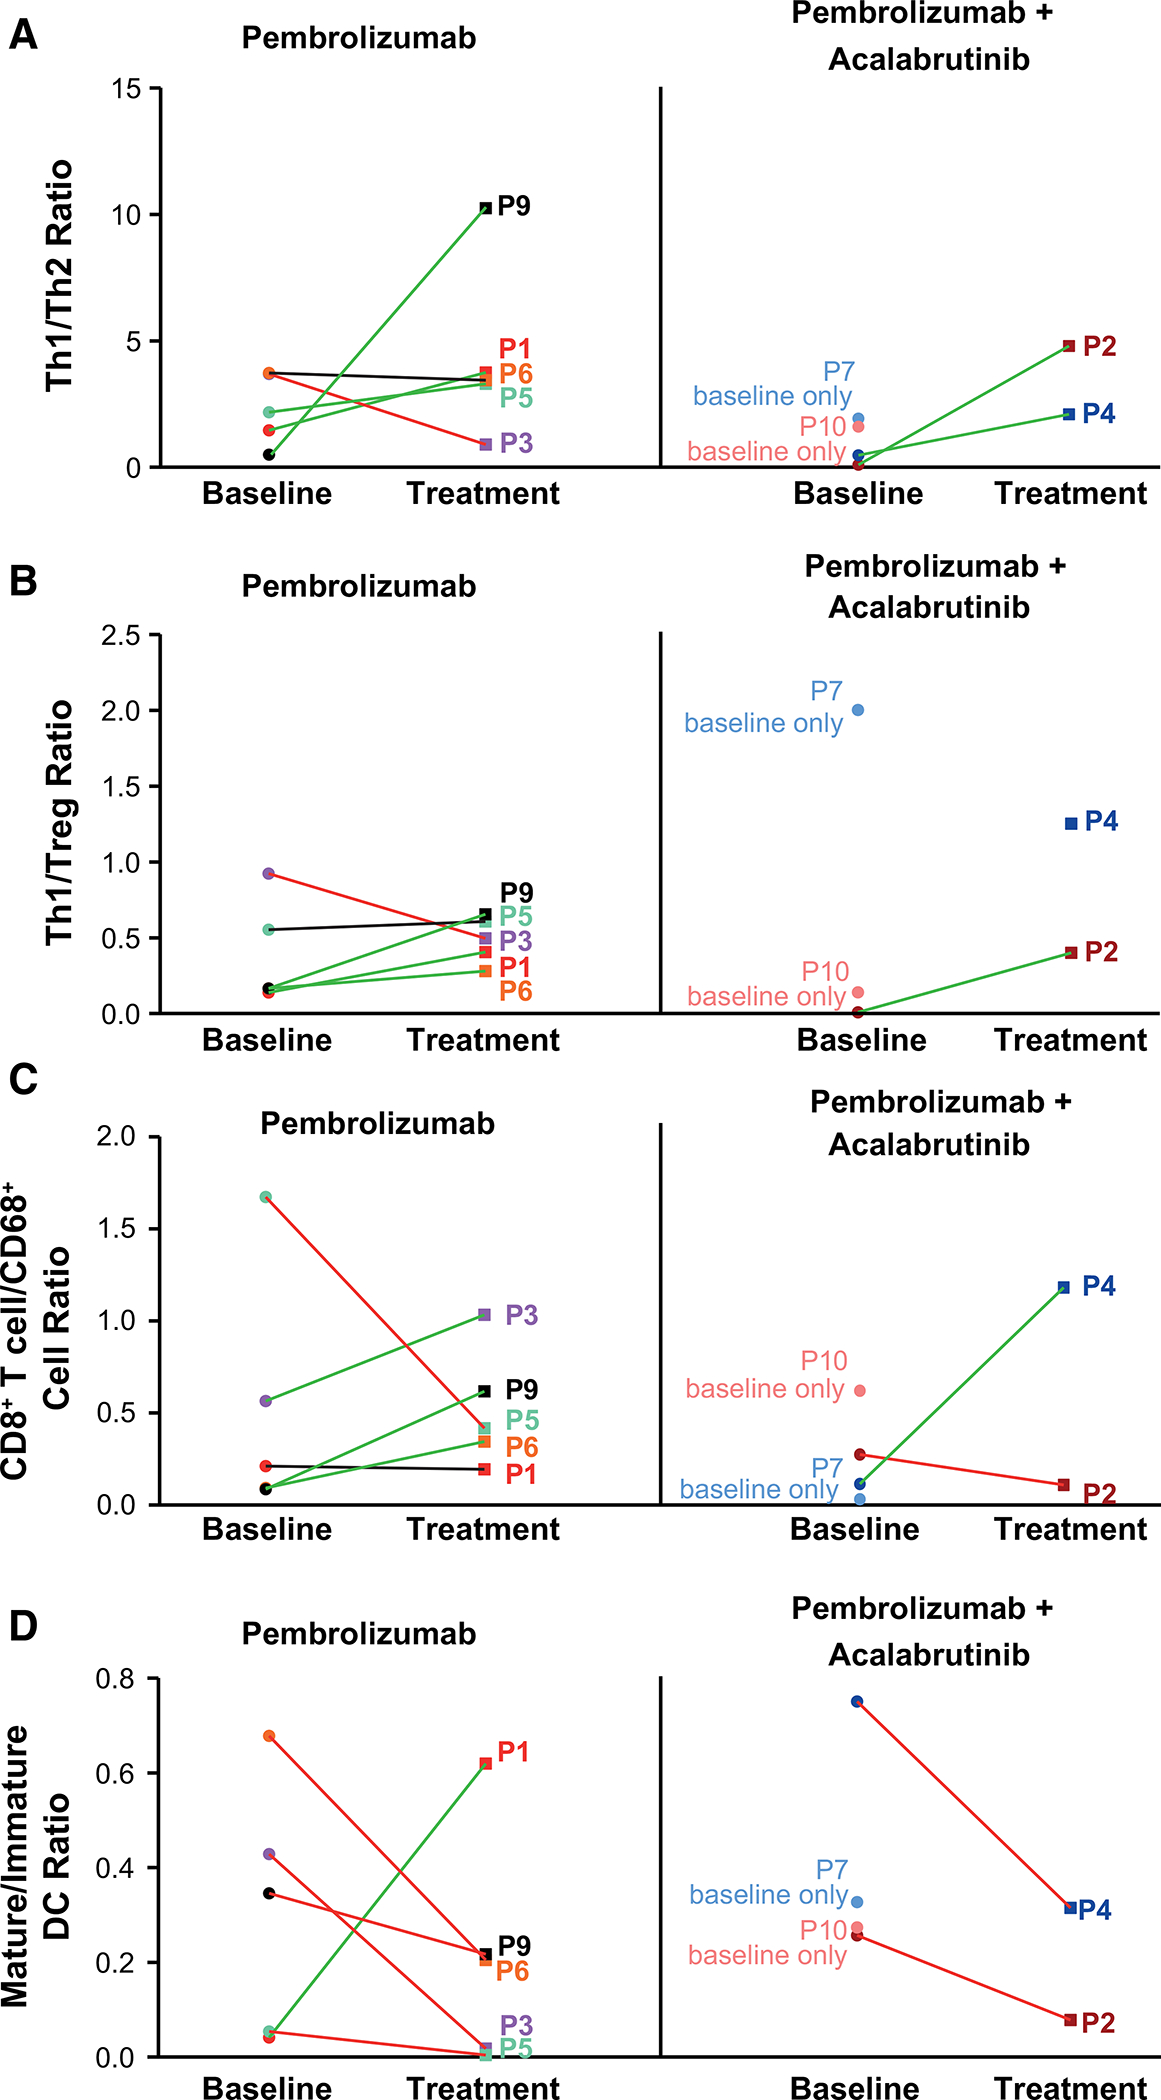
Figure 4.

TiME at baseline and after treatment. Ratios of (A) Thl (Tbet+) to Th2 (GATA-3+) CD4+ T cells, (B) Thl (Tbet+) to Treg (FoxP3+) CD4+ T cells, (C) CD8+ T cells to CD68+ monocytes/macrophages, and (D) mature (DC-LAMP+) to immature (DC-LAMP–) DCs are shown for each patient at baseline and after 43 days of treatment (Rx). Pembrolizumab monotherapy, n = 5; pembrolizumab plus acalabrutinib combination therapy, n = 4 at baseline and n = 2 at day 43. Green lines pairing baseline and Rx samples reflect a >10% increase after treatment compared with baseline, red lines indicate a >10% decrease after treatment compared with baseline, and black lines indicate a change of <10% after treatment compared with baseline. DC, dendritic cells; Th, T helper; TiME, tumor-immune microenvironment; Treg, regulatory T cells.
