
Figure 2:
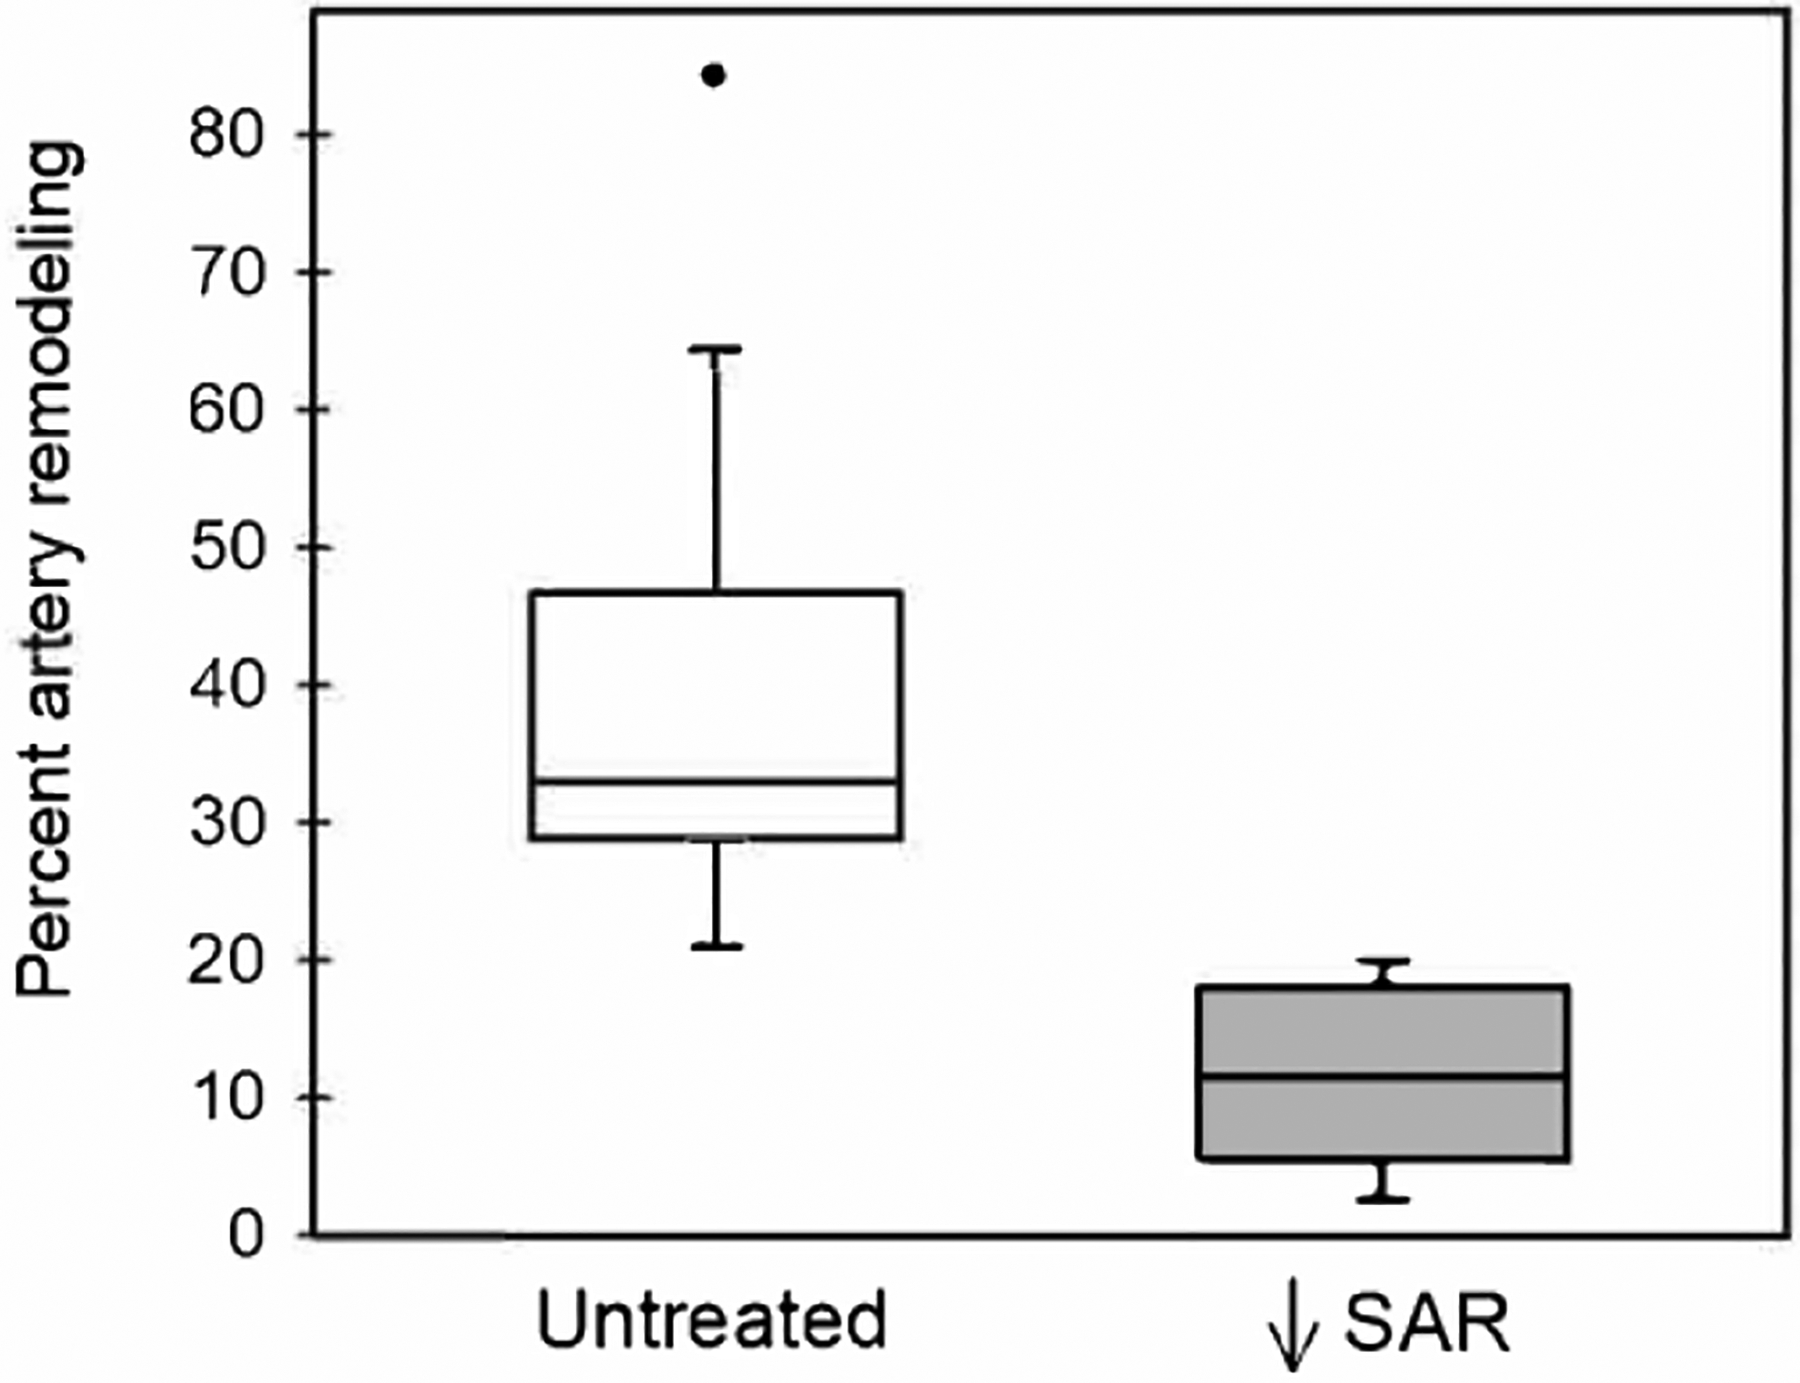
Box-and-whisker plots showing the percentage of spiral artery remodeling (i.e. number of trophoblast invaded arteries divided by total number of arteries counted), as quantified by immunohistochemical image analysis, for vessels greater than 50 μm in diameter on day 60 of gestation in untreated (n = 15) and estradiol-treated (n = 18) baboons. Boxes are median (horizontal line) and interquartile range (IQR) and whiskers are the minimum and maximum range excluding one outlier (●) more than 1.5 × IQR.