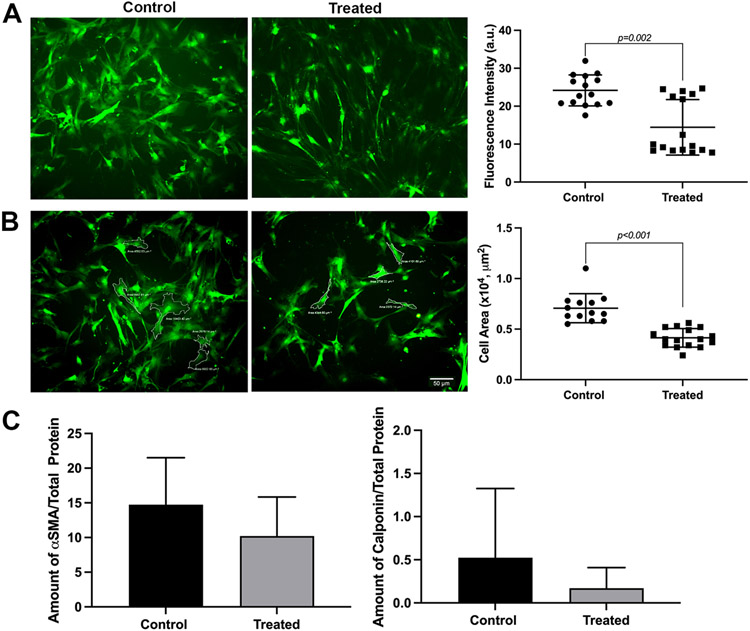
Figure 5. Effect of a cytokine cocktail on GFP intensity, MEC size and contractile protein expression.
Lacrimal gland myoepithelial cells were treated for 7 days with 3 cytokines, IL-1β, TNF-α and IFN-γ, 10 ng/ml each. (A) Representative images of MEC at day 7 following cytokine treatment showing a decrease in GFP intensity. Scale bar = 50 μm. The graph next to the images shows a statistically significant decrease in GFP intensity in treated MEC compared with the control (P = 0.002; Mann-Whitney U test). Data are means ± SD, n=15-16 from 4 repeated experiments. (B) Representative images of MEC area measurements at day 7 following cytokine treatment showing a decrease in cell size. Scale bar = 50 μm. The graph next to the images shows a statistically significant decrease of MEC size in cytokine treated compared with the control (P < 0.001; Student’s t-test; data are means ± SD, n=13-14 from 4 independent experiments). (C) Graphs showing the amount of alpha smooth muscle actin (SMA) and calponin from MEC lysates treated with cytokines for 7 days compared with the control. The amount of both proteins tends to decrease, although not statistically significant (Mann-Whitney U test), in MEC treated with cytokines compared with the control. Data are means ± SD, n = 4.

