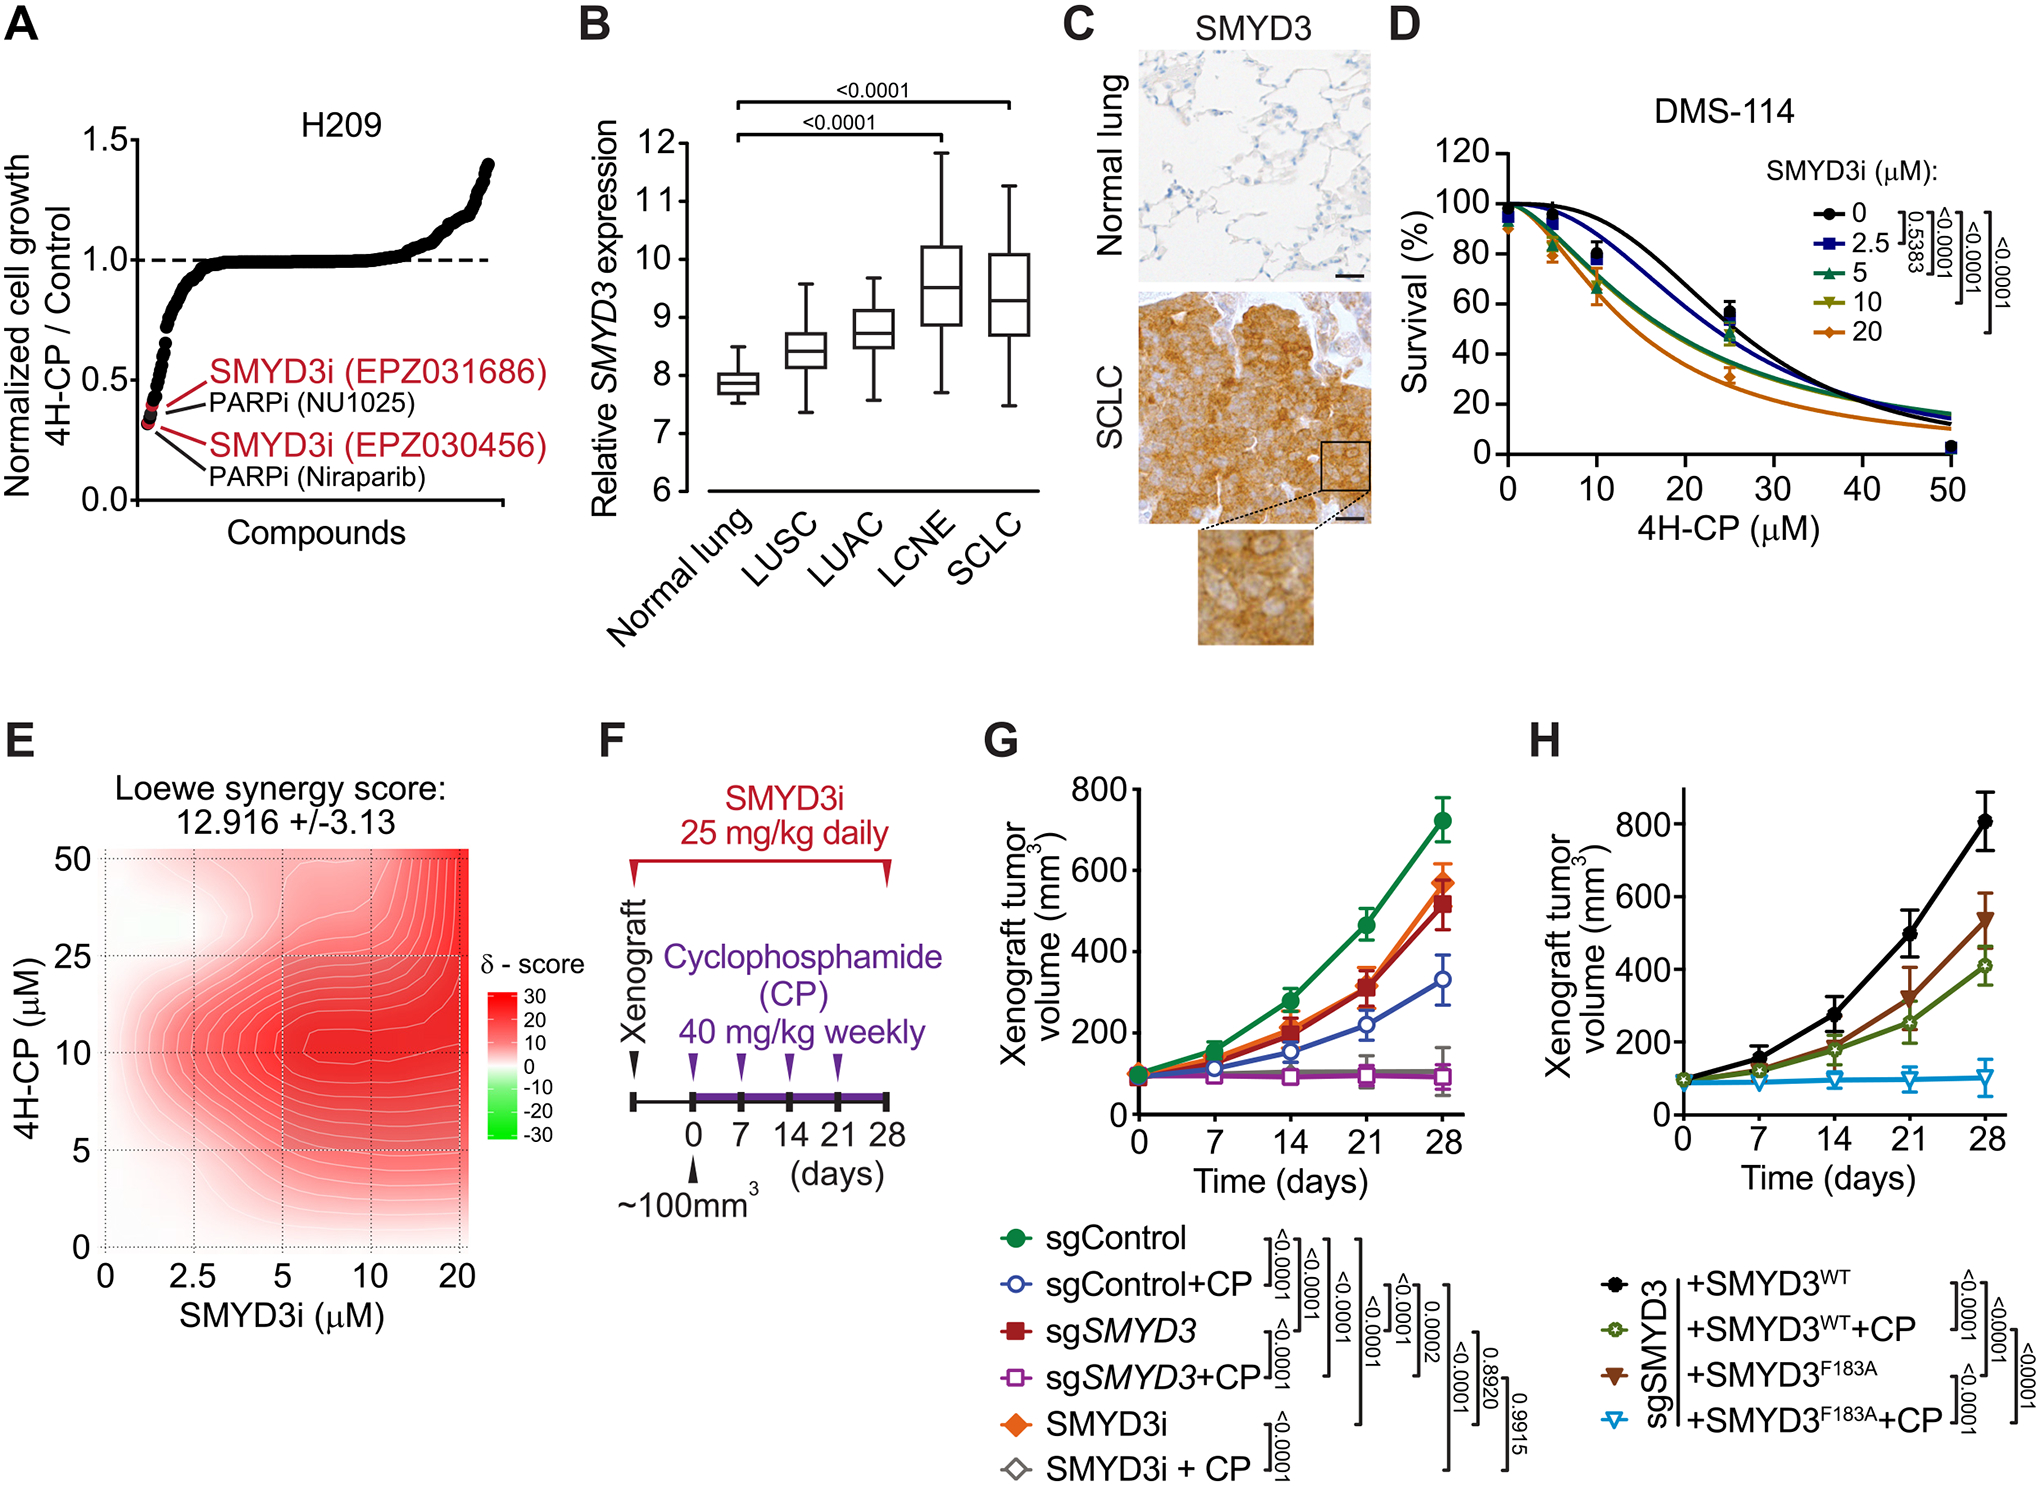
Figure 1. SMYD3 is a candidate regulator of SCLC susceptibility to alkylating chemotherapy.

A, Synthetic lethality screening using a library comprised of 285 characterized inhibitors, testing H209 SCLC cells sensitivity to alkylation damage by pre-activated form of cyclophosphamide (4-hydroperoxy-cyclophosphamide, 4H-CP). Data represent relative growth of H209 cells treated with a combination of 4H-CP (2.5 μM) and different inhibitors (1 μM each) compared to 4H-CP only (see Supplementary Table 1 and detailed description in the Methods). B, SMYD3 expression in different histological subtypes of human lung cancer (GSE30219). The box plots show the distribution of SMYD3 expression in indicated lung cancer subtypes: lung squamous cell carcinomas (LUSC, n = 61), lung adenocarcinomas (LUAC, n = 85), large cell neuroendocrine tumors (LCNE, n = 56), small cell lung cancer (SCLC, n = 20) and in adjacent normal lung tissue (n = 14). P-values were calculated using Kruskal−Wallis test. C, Representative immunohistochemical (IHC) staining of SMYD3 in normal human lung (n = 8) and tumor biopsies obtained from patients with confirmed SCLC (n = 24). A magnification is provided. All 24 analyzed SCLC biopsies showed positive nuclear and cytoplasmic SMYD3 staining with H-score >180 in 20 samples and H-score >100 in 4 samples. Scale bars, 50 μm. D, Analysis of DMS-114 SCLC cell line growth response to increasing concentrations of 4H-CP with or without SMYD3i (EPZ031686) at the indicated concentrations. Percentage of viable cells was normalized to control vehicle treated cells. P-values were calculated by two-way ANOVA with Tukey’s testing for multiple comparisons. Data are represented as non-linear regression with mean ± SEM. E, Quantification of 4H-CP and SMYD3i combination treatment synergy using the Loewe model. Loewe synergy score was calculated from DMS-114 cell survival assays (as in D, SynergyFinder 2.0). F, Schematic of xenografts and cyclophosphamide (CP) treatment schedule using SCLC H1092 cells modified to express a control non-targeting sgRNA (sgControl) or a Cas9/sgRNA targeting SMYD3 (sgSMYD3) complemented or not using either WT or F183 inactive mutant SMYD3, or treated with SMYD3i (EPZ031686). The cells were grafted subcutaneously to immunocompromised NSG mice. G, Quantification of H1092 xenograft tumor volume (n = 5 mice, for each treatment group) is shown. Animals in control groups received placebo (vehicle) treatment. P-values were calculated by two-way ANOVA with Tukey’s testing for multiple comparisons, Data are represented as mean ± SEM. H, Quantification of H1092 xenograft tumor volume (n = 5 mice, for each treatment group) is shown. P-values were calculated by two-way ANOVA with Tukey’s testing for multiple comparisons, Data are represented as mean ± SEM.
In all panels, representative of at least three independent experiments is shown unless stated otherwise.
