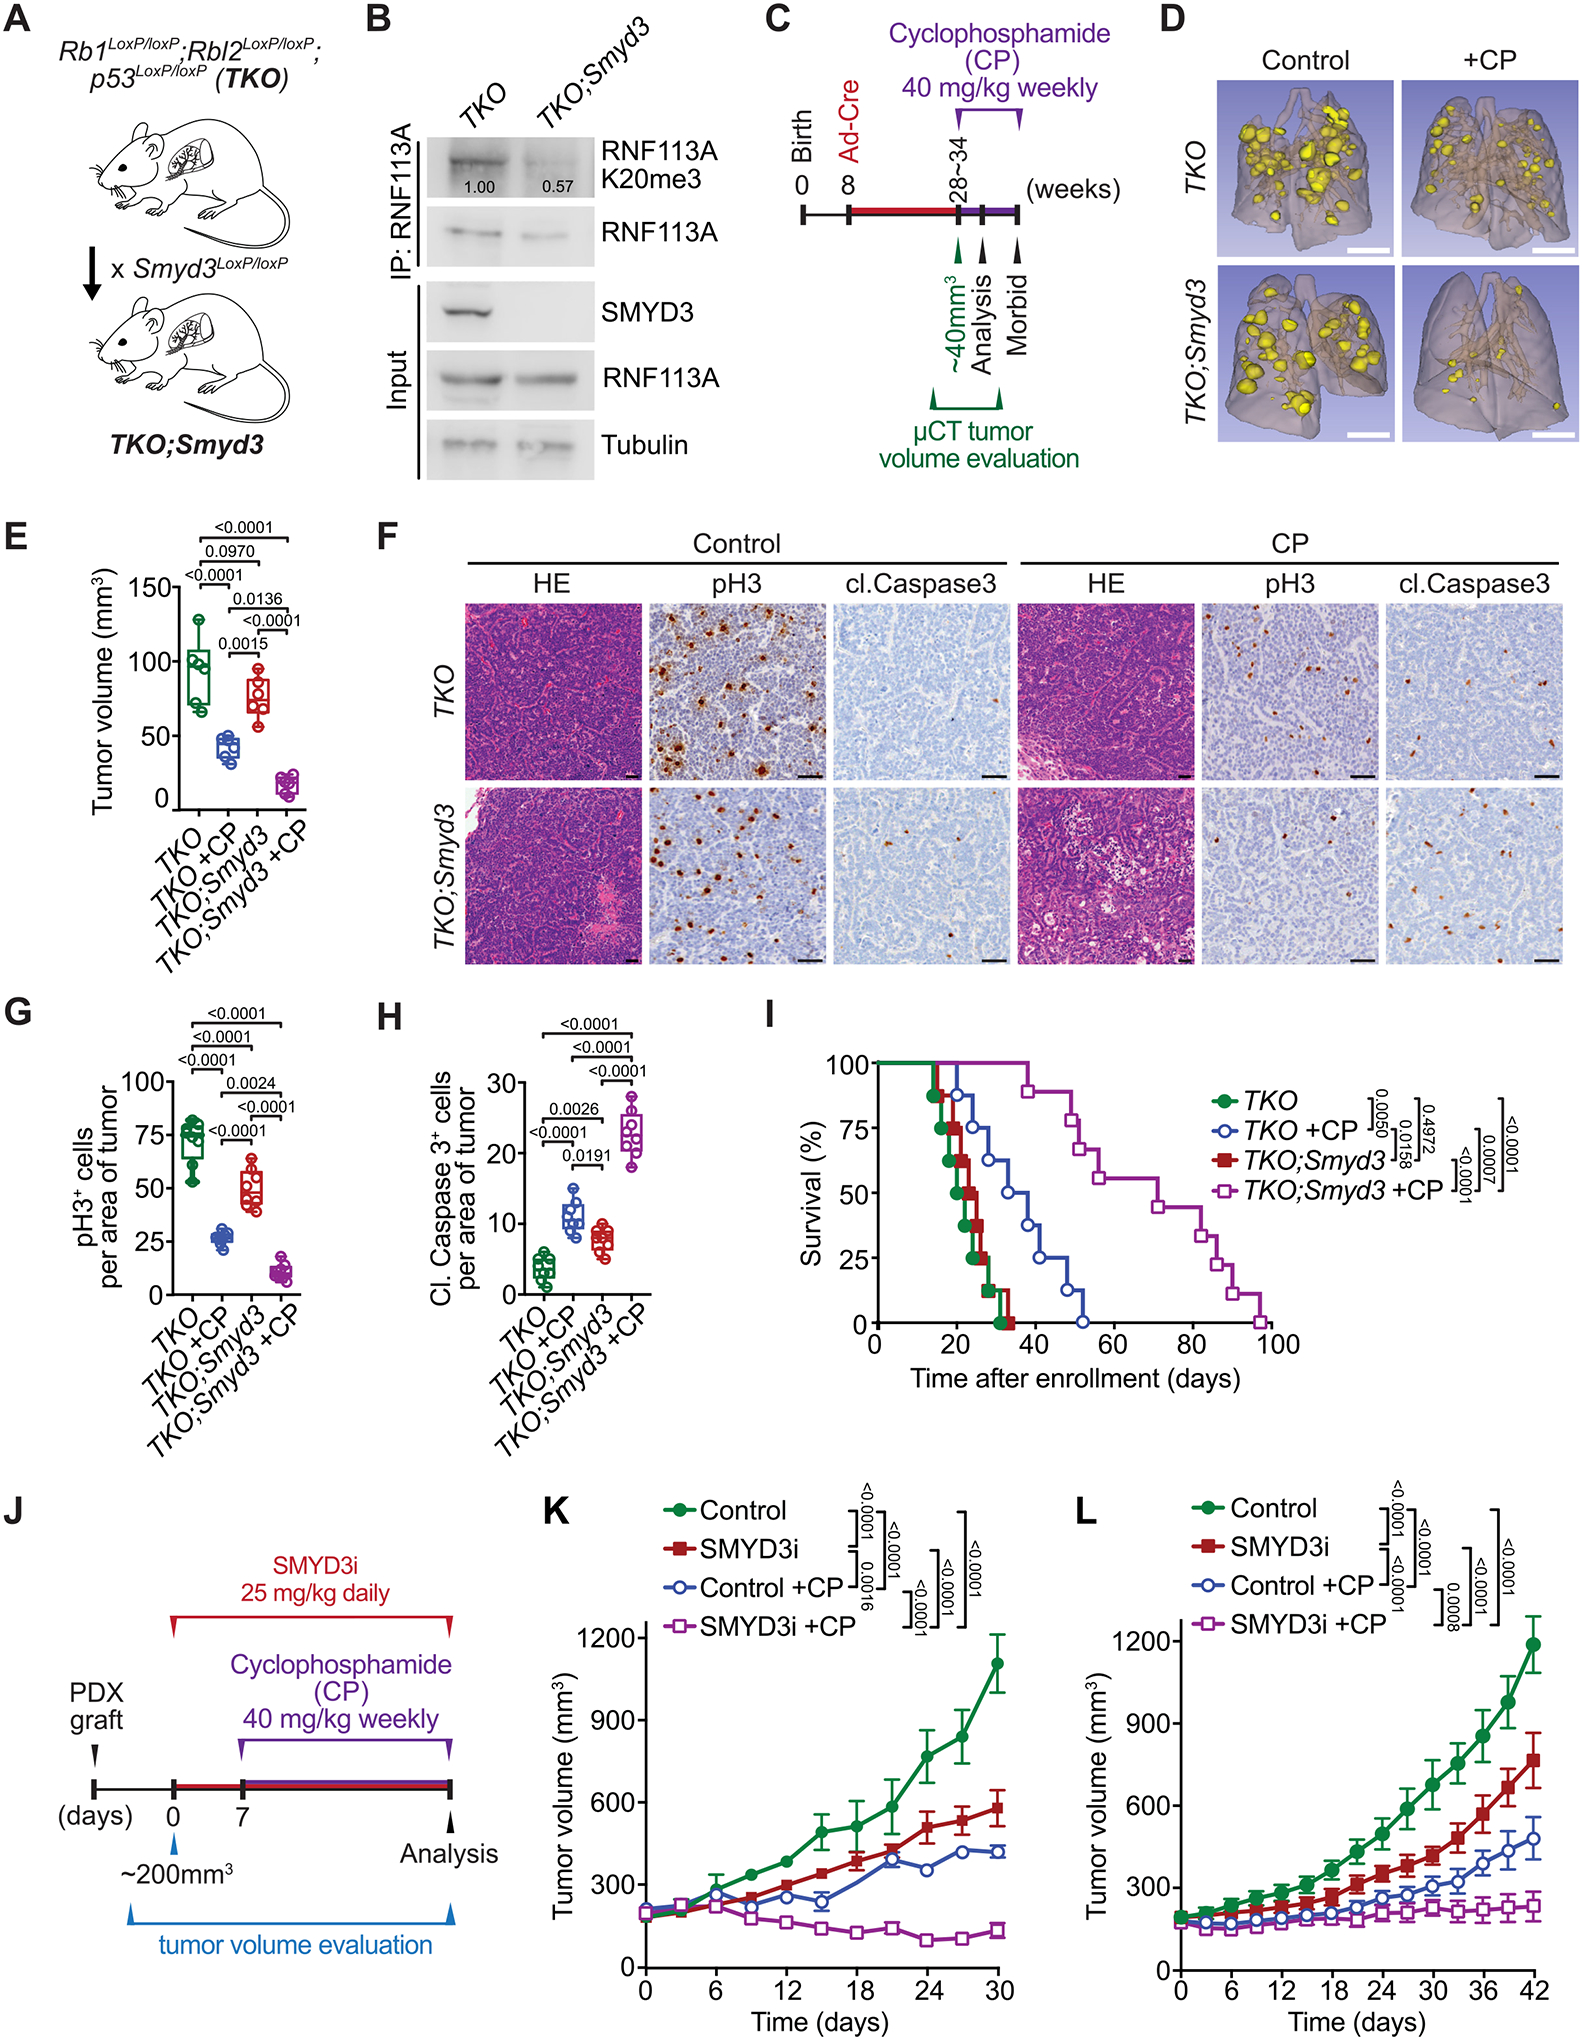
Figure 7. SMYD3 inhibition sensitizes SCLC to alkylating agents in vivo.

A, Schematic of a SCLC mouse model with conditional deletion of Rb1, Rbl2 and Tp53 (Triple knockout, TKO) and generation of conditional Smyd3 mutant in the TKO background (TKO;Smyd3). B, Immunoblot analysis of endogenous RNF113A K20me3 methylation following immunoprecipitation of total RNF113A in cell lines originating from TKO and TKO;Smyd3 mutant mice. SMYD3 is provided as a validation of successful Smyd3 deletion in TKO;Smyd3 mice. Tubulin was used as a loading control. C, Schematic of treatment procedures to induce SCLC in TKO and TKO;Smyd3 mutant mice followed by evaluation of therapeutic response to cyclophosphamide (CP). Tumor volume was evaluated by micro-computed tomography (μCT). Animals were enrolled in the study once tumor volume reached approximately 40 mm3 for TKO control animals on average at 28 and TKO;Smyd3 at 35 weeks after tumor induction. Mice cohorts were analyzed at 15 days post enrolment after receiving two rounds of CP, or were continuously treated with CP or vehicle (control) until signs of morbidity to establish overall survival. D, Representative μCT scans at 15 days post enrolment in TKO and TKO;Smyd3 mutant mice treated with vehicle (control) or CP. (representative of n = 6 mice for each experimental group). Scale bars, 1 cm. E, Quantification of tumor volume in TKO and TKO;Smyd3 mutant mice treated with vehicle (control) or CP. Boxes represent 25th to 75th percentile, whiskers: min. to max., center line: median. P-values were calculated by two-way ANOVA with Tukey’s testing for multiple comparisons. F, Representative HE and IHC staining for cell proliferation marker phospho-Histone 3 (pH3) and apoptosis maker cleaved Caspase 3 (cl. Caspase 3) of lung tissue from vehicle (control) and CP treated TKO and TKO;Smyd3 mutant mice (representative of n = 6 mice for each experimental group). Scale bars, 50 μm. G-H, Quantification of proliferation (pH3 positive cells) (G) and apoptosis (cl. Caspase 3 positive cells) (H) in samples as in (F). Boxes represent 25th to 75th percentile, whiskers: min. to max., center line: median. P-values were calculated by two-way ANOVA with Tukey’s testing for multiple comparisons. I, Kaplan-Meier survival curves of control TKO (med. survival post enrolment: 21 days, n = 8), control TKO;Smyd3 (med. survival post enrolment: 24 days, n = 8), TKO +CP treatment (med. survival post enrolment: 35.5 days, n = 8) and TKO;Smyd3 +CP treatment (med. survival post enrolment: 71 days, n = 9). P-values were calculated by log-rank test. J, Schedule protocol for SCLC PDX treatment with cyclophosphamide (CP) and SMYD3 inhibitor EPZ031686 (SMYD3i). Mice undergoing monotherapy also received vehicle treatment. K-L, Tumor volume quantification for patient-derived SCLC xenografts obtained from therapy naïve (K) and treated with standard chemotherapy (Carboplatin and Etoposide) patient (L) grafted subcutaneously to immunocompromised NSG mice (n = 6 mice, for each treatment group). P-values were calculated by two-way ANOVA with Tukey’s testing for multiple comparisons. Data are represented as mean ± SEM.
In all panels, representative of at least three independent experiments is shown unless stated otherwise. The numbers below the immunoblot lines represent the relative signal quantification (see also Supplemental Table 5).
