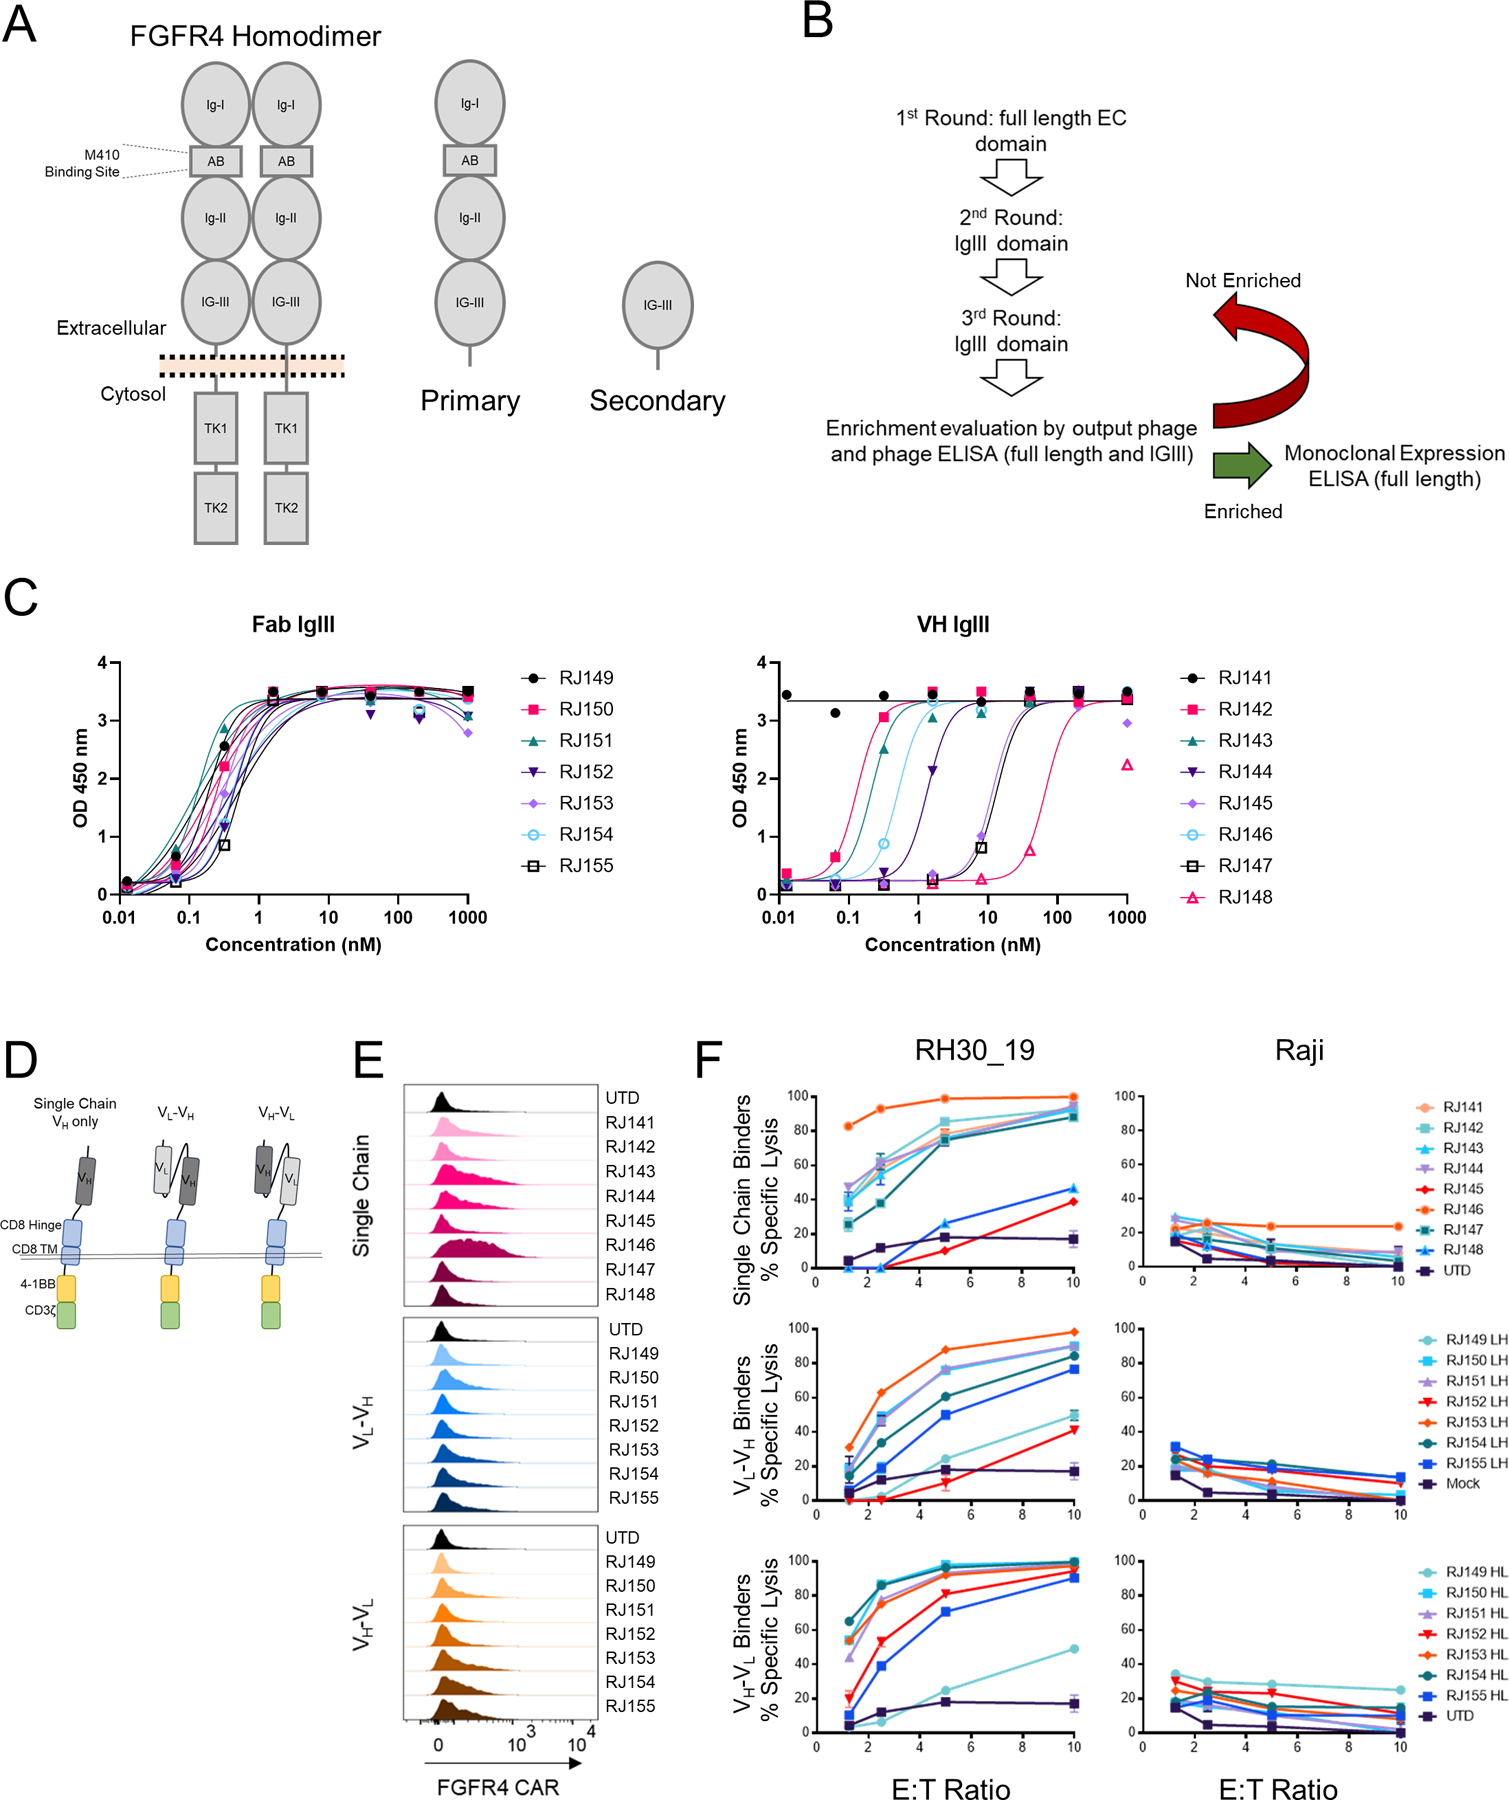
Figure 1. Isolation of new FGFR4 binding moieties and Screening anti-FGFR4 CAR-T.

A. Schematic of FGFR4 homodimer and the FGFR4 protein fragments used for panning new binders. Full length antigen (Primary) was used for the first round of panning FGFR4 binders, followed by an IgIII-domain only fragment (Secondary) in subsequent rounds. B. Panning workflow included three rounds of panning, phage enrichment and binding evaluation. C. ELISA targeting FGFR4 IgIII domain only with either Fab binders (left panel) or VH-only binders (rightpanel). Increasing amounts of soluble binder (x-axis) were added to antigen coated plates, and specific binding quantified by ELISA (y-axis, as in Methods).D. Schematic of CAR structure. The thin double line represents the plasma membrane, which is transited by the CD8 transmembrane (TM) domain and linked to intracellular signaling domains derived from 4–1BB and the CD3-ζchain. The extracellular aspect of the CAR contains a hinge domain derived from CD8 which links to single chain (dark gray) or scFv-based (light gray and dark gray) antigen binding domains derived from phage display, Figure 1. E. Surface expression of anti-FGFR4 CARs was tested in healthy donor PBMCs day 9 post activation. CAR was detected using recombinant FGFR4-Fc-Biotin and SA-PE to directly bind CAR on the cell surface. Surface-stained cells were visualized using flow cytometry. F. Cytotoxicity of CAR T cells was assessed using CTL assays against FGFR4-expressing RH30_19 RMS cell line and FGFR4-negative Raji-ffLuc cells. Target cells were plated at 10,000/well with CAR T cells added at the indicated E:T ratios, and co-incubated for 20 hours. Percent specific lysis was determined by luminescent signal from surviving tumor cells. D. IFN-γ and TNFα cytokines released during 20-hour co-incubation with FGFR4-expressing RH30_19 target cells were quantified using LegendPlex bead-based cytokine assay. Controls include unstimulated T cells (Unstim) and T cells activated for transduction but not exposed to LV (UTD). All assays were conducted in triplicate and independently repeated three times.
