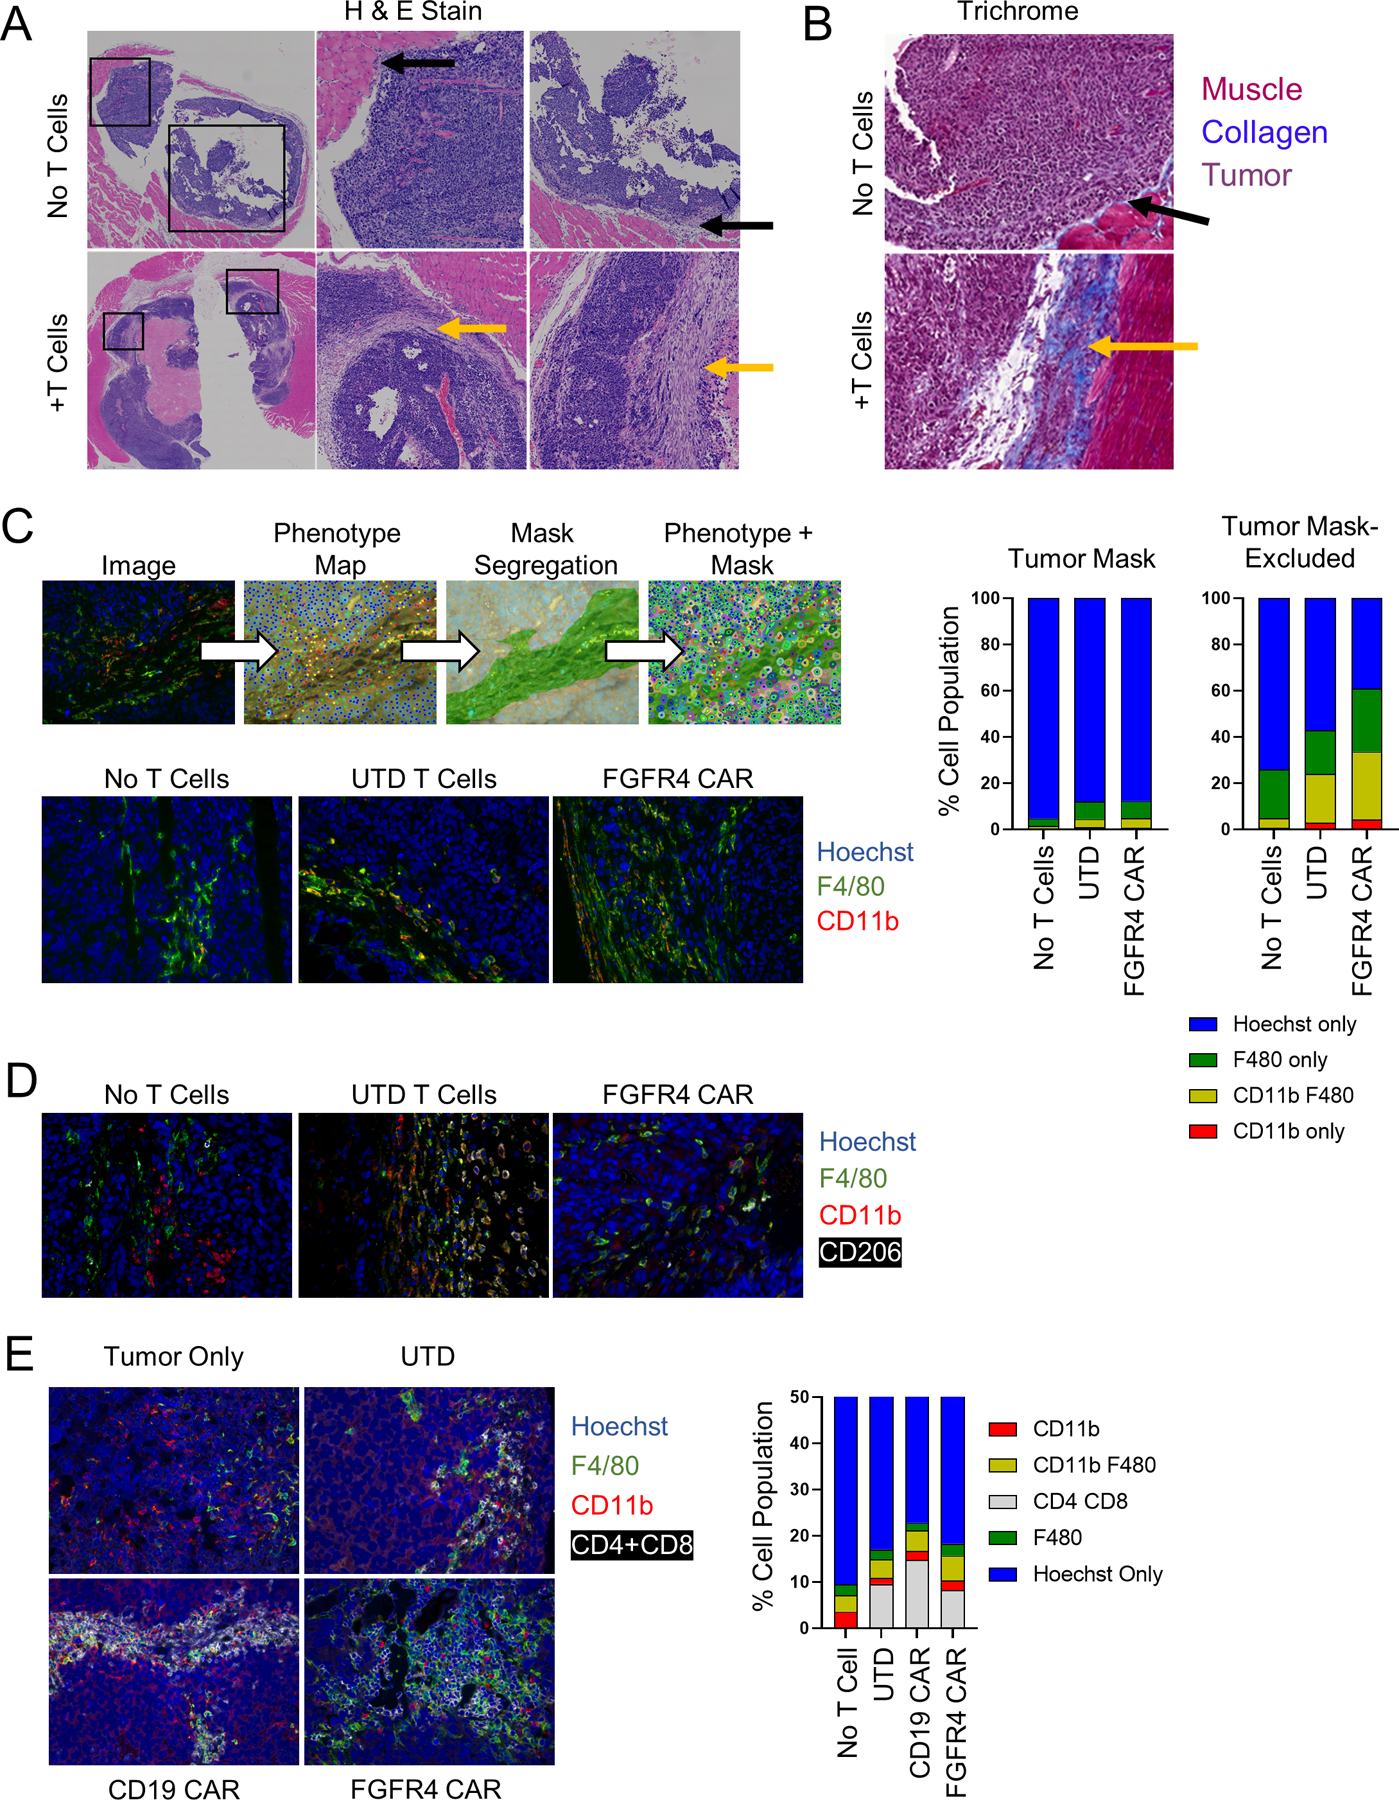
Figure 5. T cell therapy induces tumor stroma formation.

A, B. Untreated or T cell treated intramuscular RH30_19 tumors were excised and stained with H&E, with central and right panels showing enlargements of the indicated boxed areas (A) or TriChrome stained to highlight collagen deposition (blue) (B). Yellow arrows indicate regions of stroma/collagen deposition as opposed to the tumor-stromal interface in untreated mice (black arrows). C. Untreated or T cell treated RH30_19 tumors were stained with α-Luciferase (tumor), mouse α-CD11b, and α-F4/80. A phenotype map was created to indicate the identity of each cell within the field of view. Luciferase staining was used to determine tumor cells and create a mask of tumor and non-tumor regions. Myeloid cells were counted within both regions (phenotype + mask) as demonstrated. The proportion of myeloid cells in untreated, T cell treated, or anti-FGFR4 CAR treated mice is shown in the representative images and plotted to the right. D. The presence of tumor-associated macrophages was determined with immunofluorescence staining of CD206 along with CD11b and F4/80 in RH30_19 tumors excised from untreated, untransduced T cell, or FGFR4 CAR-T cell treated mice. E. CD4 and CD8 T cells localized to myeloid-rich regions as shown by immunofluorescent staining with CD4+CD8, CD11b, and F4/80 in RH30_19 tumor samples with the indicated treatments.
