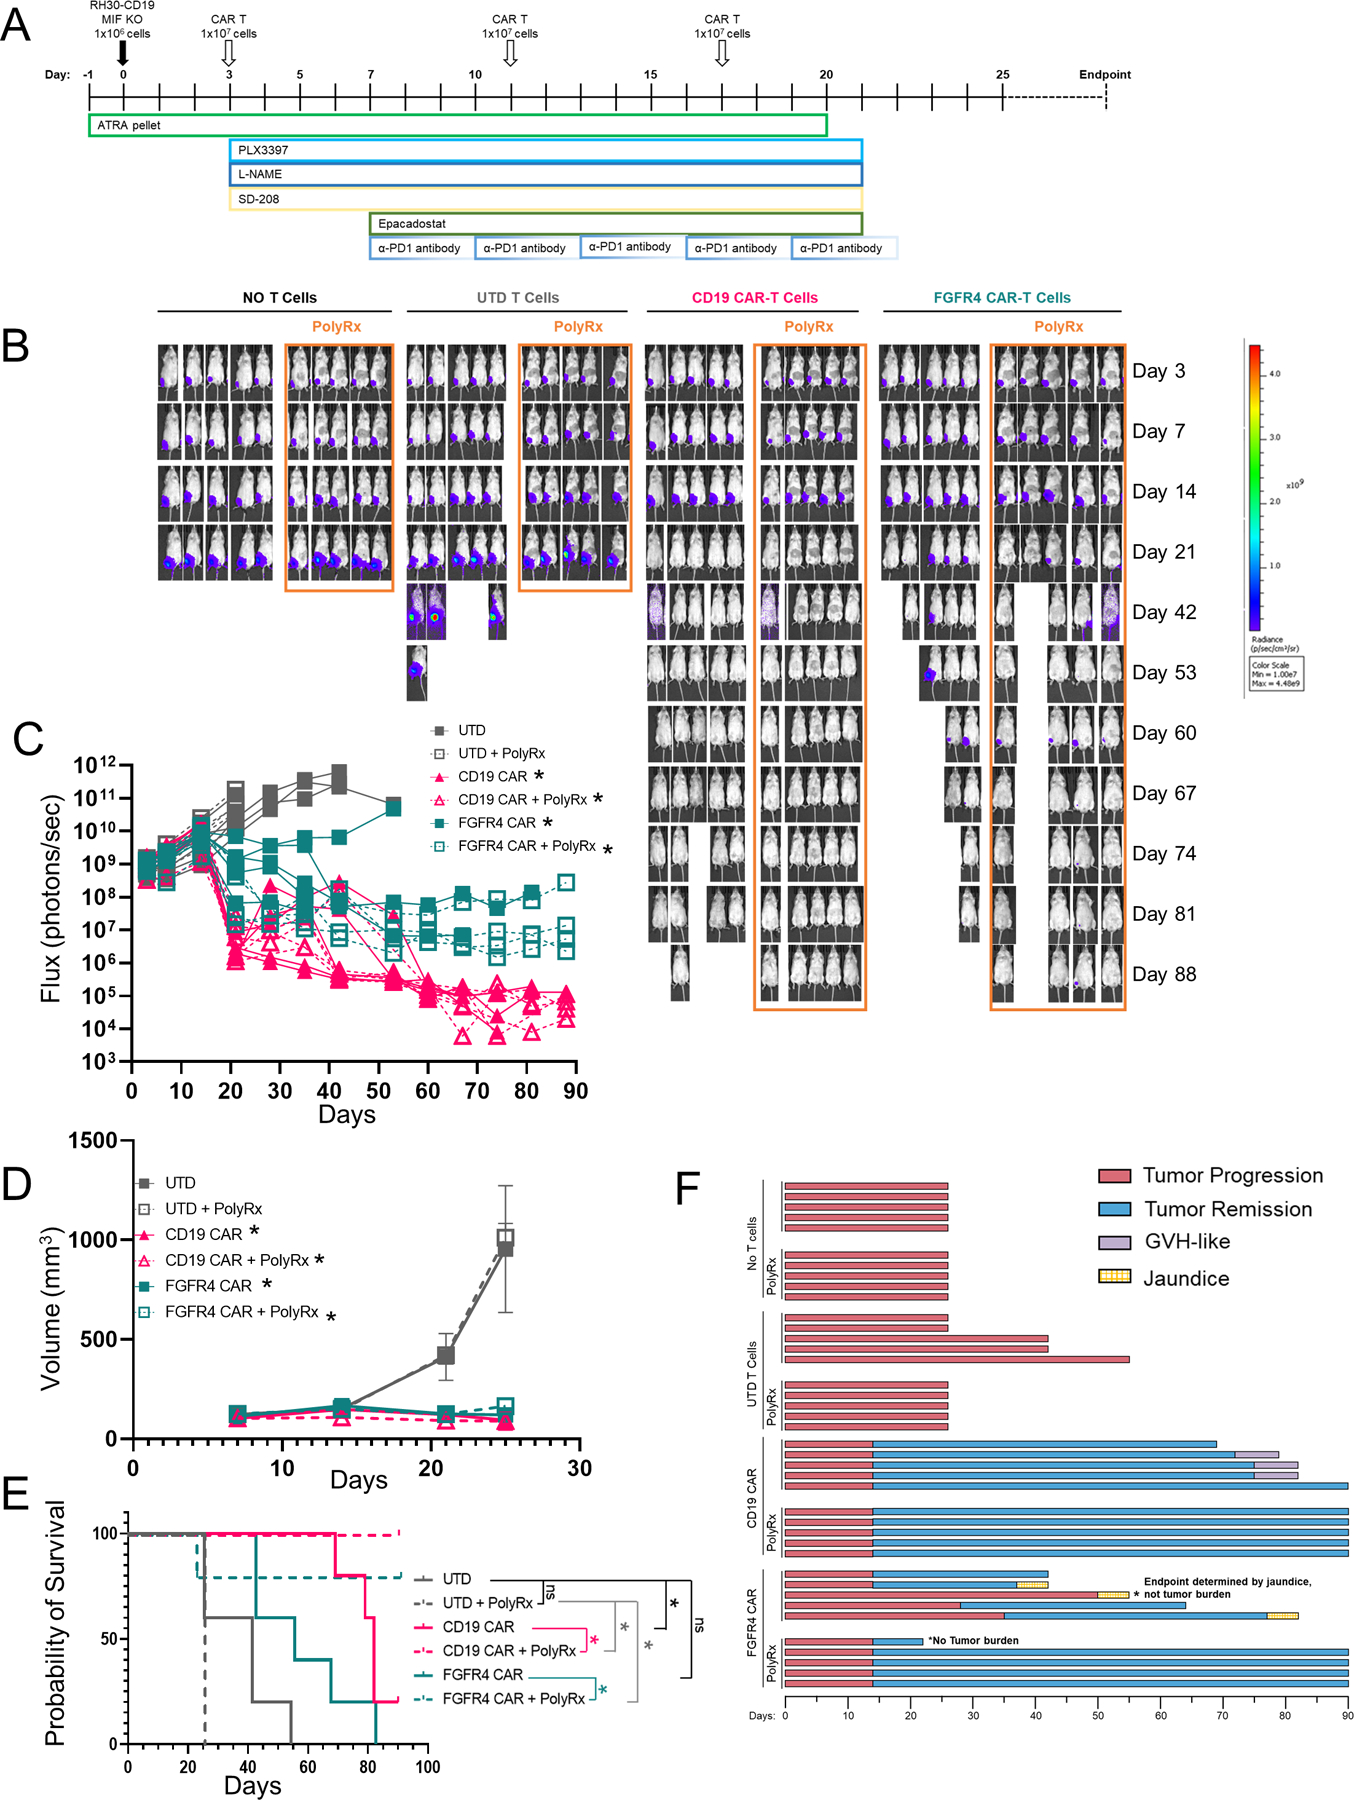
Figure 6. Anti-myeloid poly-pharmacy allows CAR-T cells to clear orthotopic RMS tumors.

A. Schematic timeline of anti-myeloid PolyRx treatments and CAR-T treatment. Closed boxes around each treatment indicate its duration. B. Mice were imaged weekly by IVIS to assess tumor growth. C. Flux measured by IVIS was plotted for individual mice treated with UTD T cells, anti-CD19 CAR, or anti-FGFR4 CAR (PS525) with and without PolyRx. D. Tumor volume as measured by caliper measurement, averaged for each treatment group. E. Kaplan-Meier survival curve of treated groups with (dotted lines) or without (solid lines) PolyRx. F. Swimmer plot of mouse survival (length of bar), tumor progression/regression (red/blue, respectively), and toxicities (graft versus host, purple; jaundice, yellow), to the end of the assay (day 90).
