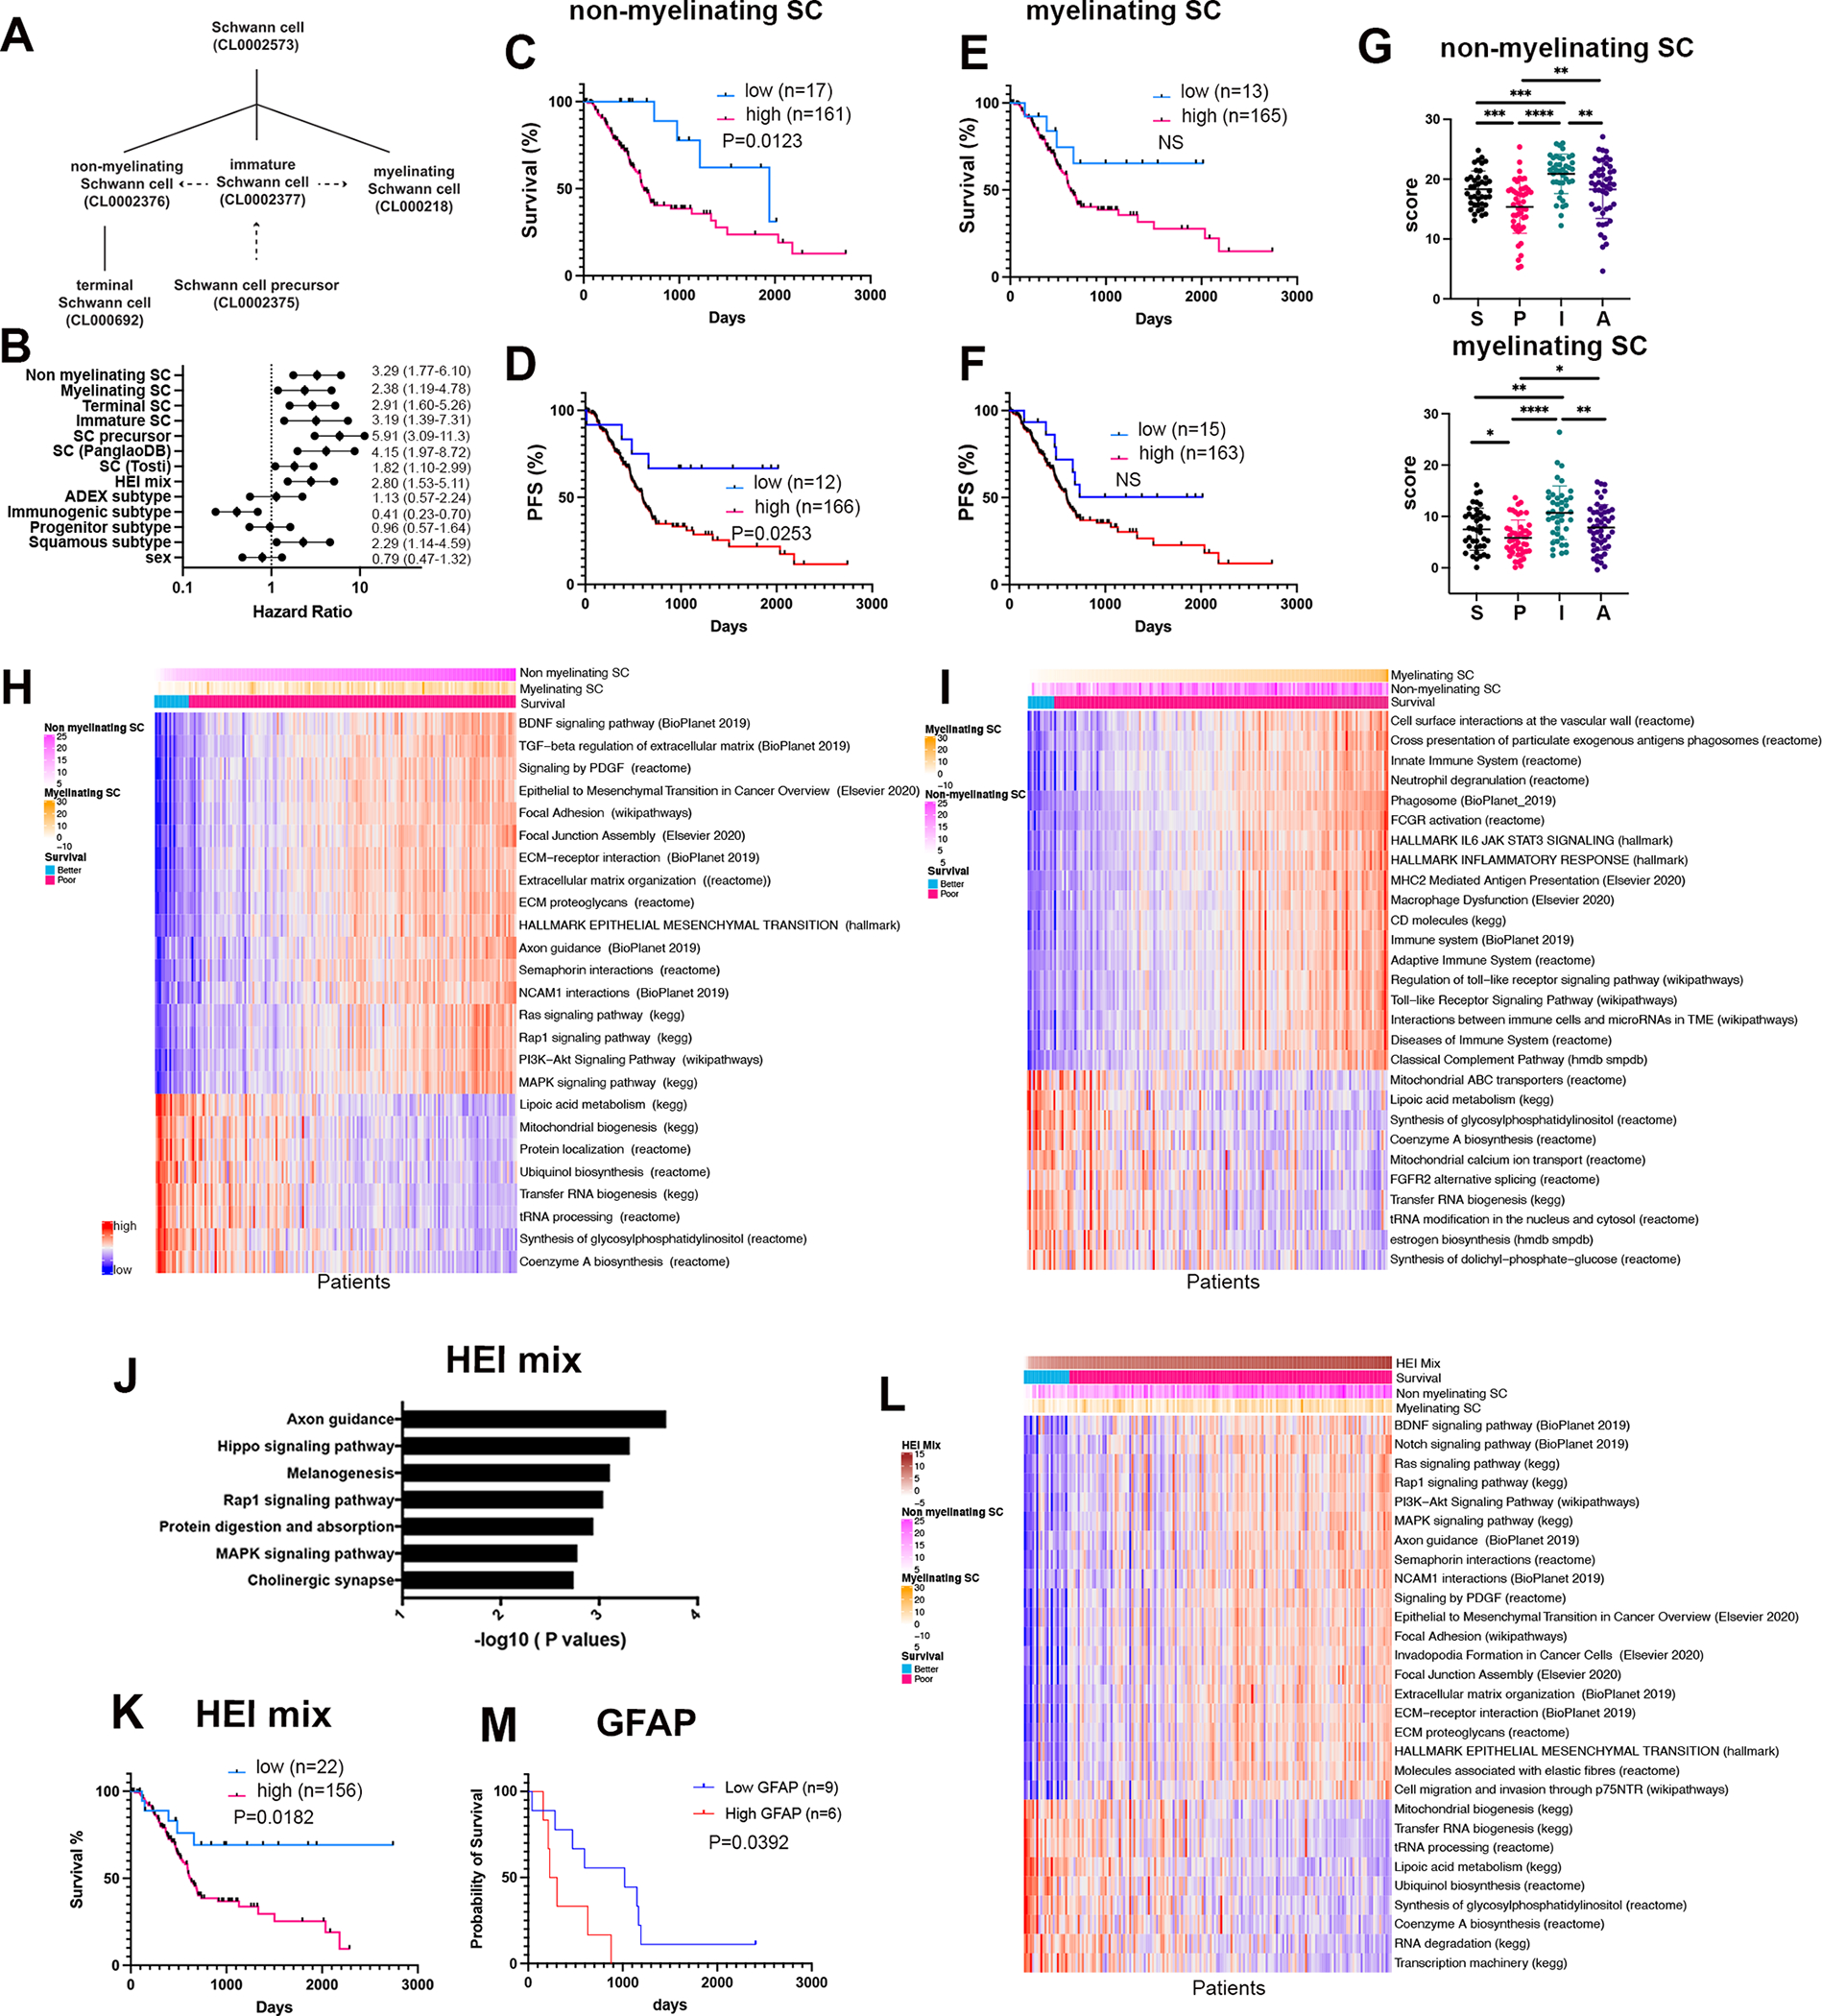
Fig. 1 |. Non-myelinating SC signature scores correlate with diminished survival in patients with pancreatic adenocarcinoma and with pathways related to cancer invasion.

A, Hierarchical organization of SCs from Tabula Sapiens (full lines) with dashed arrows indicating transitions in the SC lineage(22). B, Forest plot with hazard ratio and 95% CI. C-F, Kaplan–Meier curves of overall survival (C,E) and progression free survival (PFS) (D,F) with high or low scores for signatures of non-myelinating SC (C,D), and myelinating SC (E,F) in 178 TCGA PAAD patients. G, Non-myelinating and myelinating SC signature scores in PDAC subtypes (S:squamous, P:progenitor, I:Immunogenic, A:ADEX). H-I, Heatmap of gene sets correlating with high and low scores for non-myelinating SC signature (H) and myelinating SC signature (I) in TCGA PAAD patients. Columns represent TCGA PAAD samples that have been rank ordered by the top row signature. Arrows indicate survival cutoff used in b and d with low survival patients at the left of the arrow. J, Top 7 enriched pathways in HEI-286 co-cultured with MiaPaCa-2 as compared with HEI-286 SCs alone (EnrichR, human KEGG 2019 dataset). K, Kaplan–Meier curve of overall survival with high or low scores for the cancer exposed HEI-286 SC (HEImix) signature in 178 TCGA PAAD patients. L, Heatmap of gene sets correlating with high and low scores for cancer exposed HEI-286 SC (HEImix) signature in TCGA PAAD patients. Columns represent TCGA PAAD samples that have been rank ordered by the top row signature. M, Kaplan–Meier of overall survival of PDAC patients with high or low GFAP expression in SCs determined histologically.
