
Figure 2.
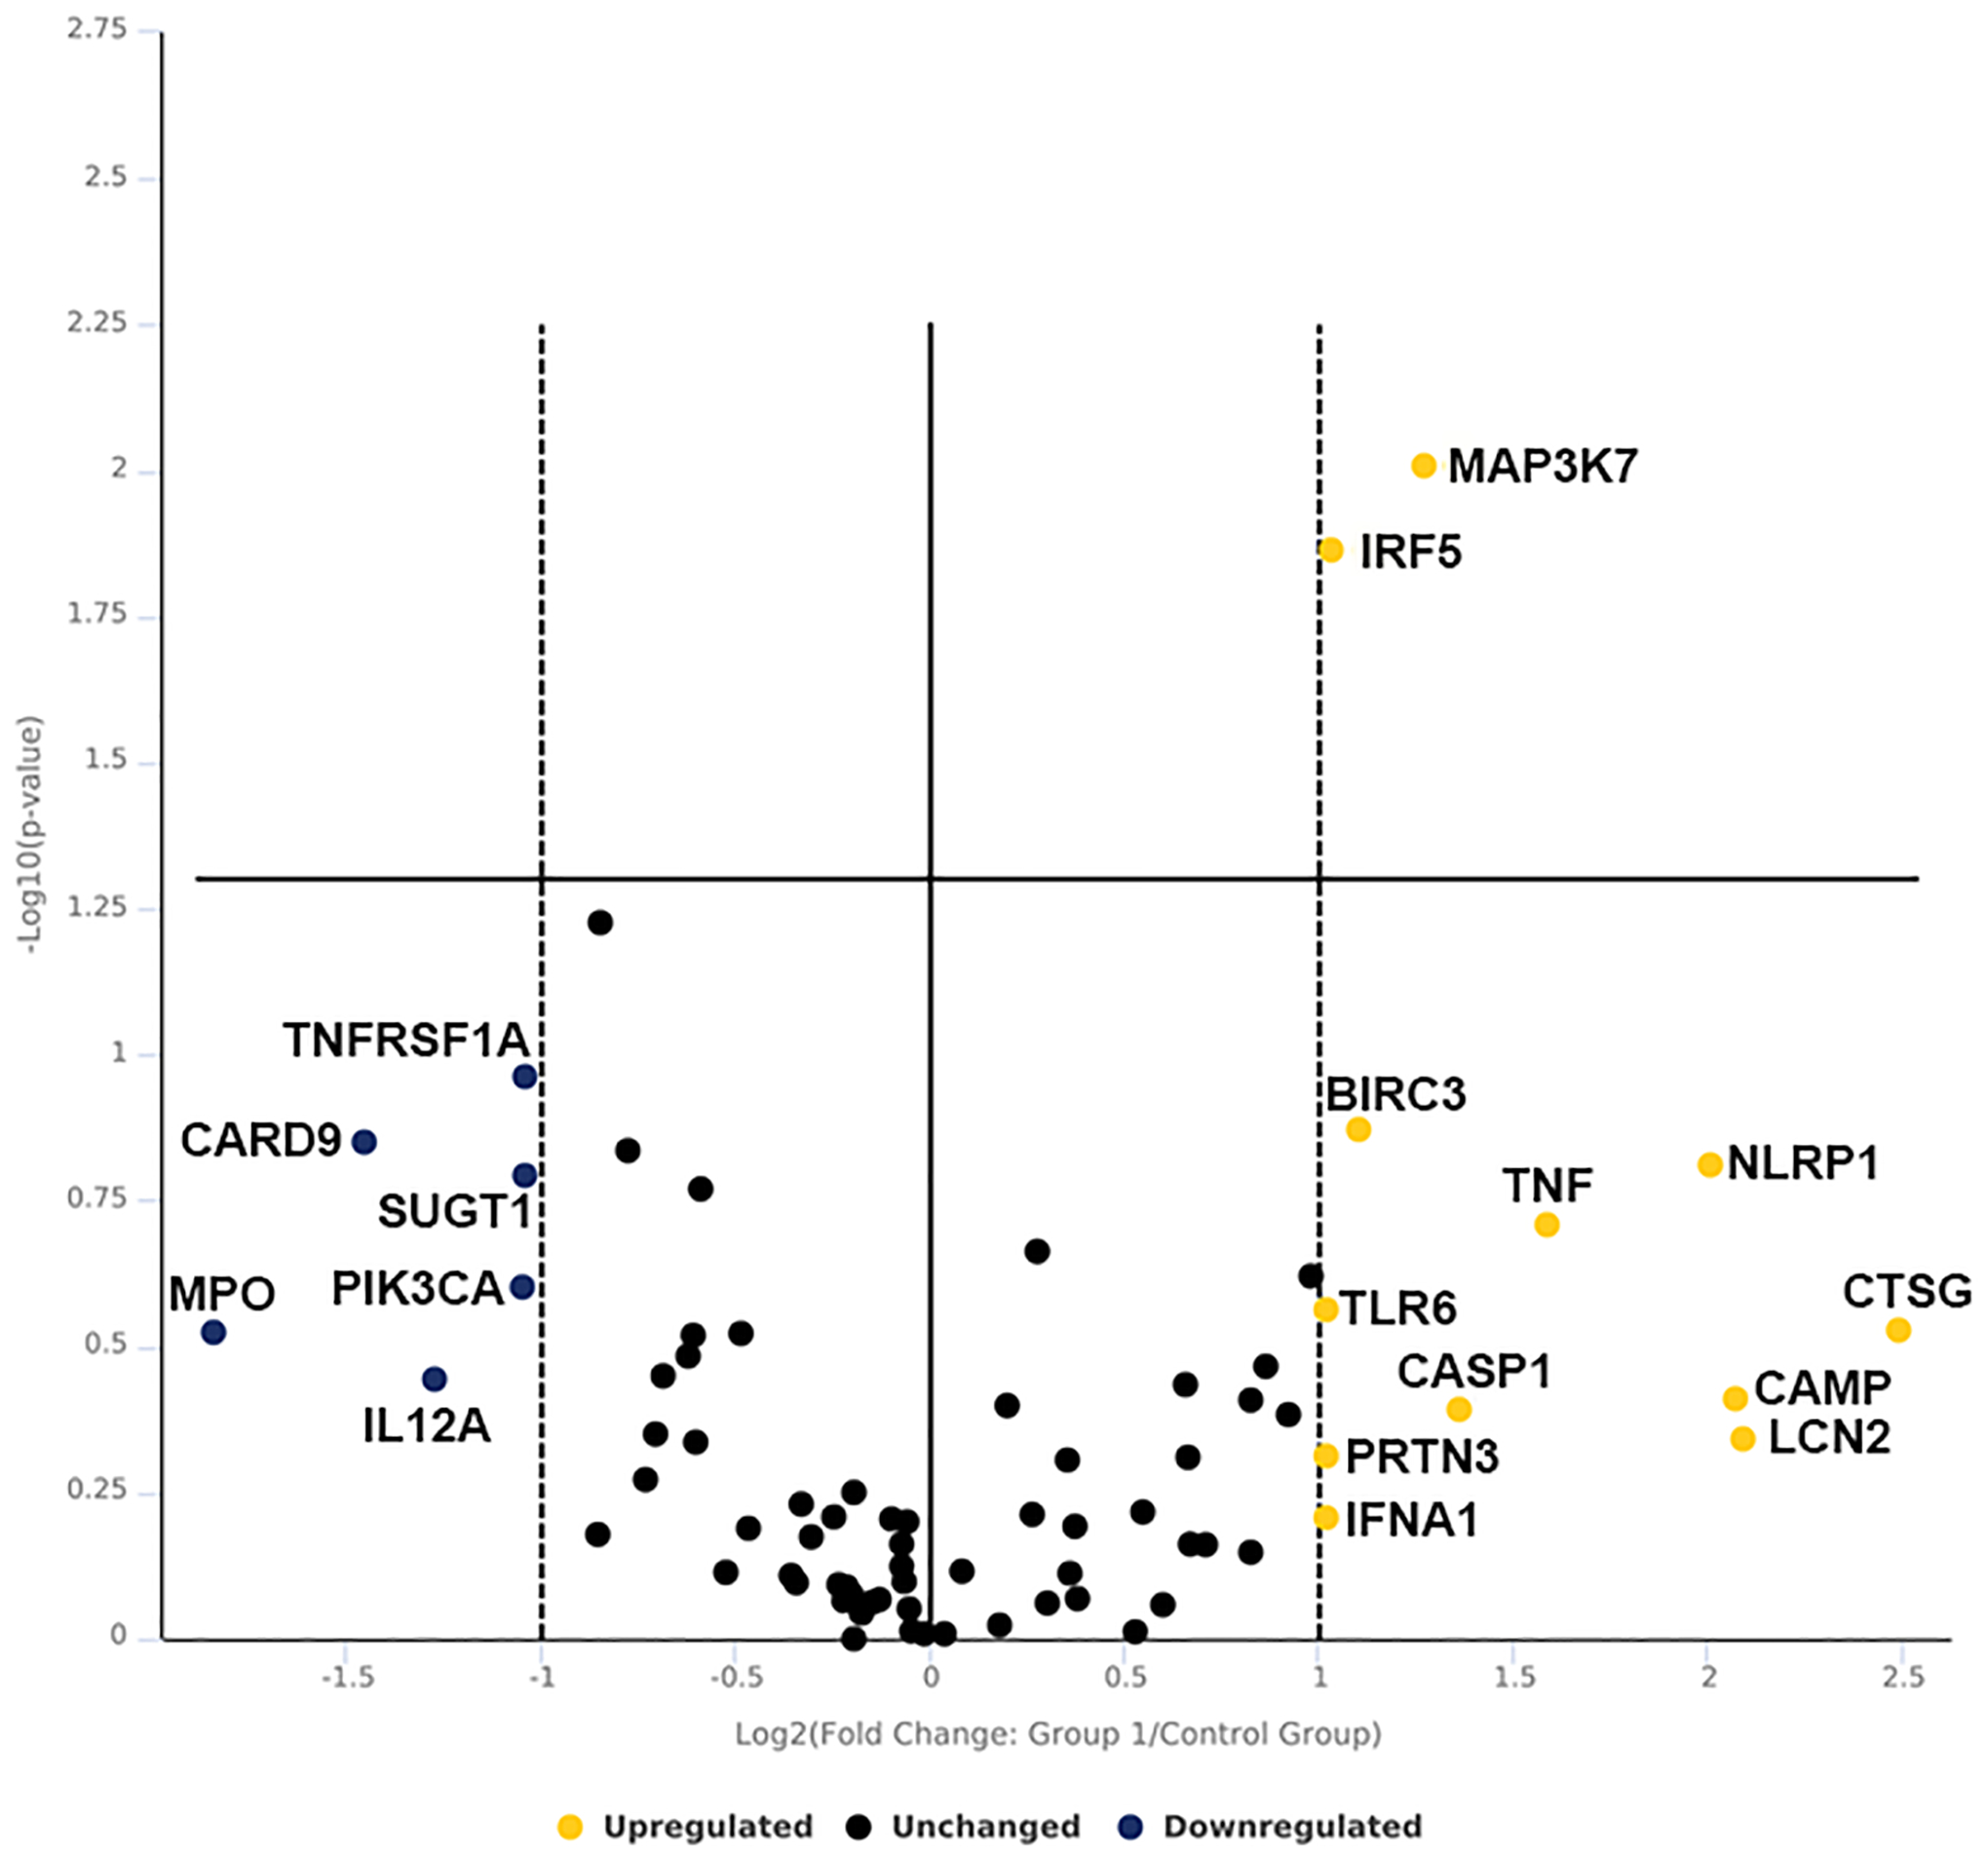
Volcano plot of human IC RT2 antibacterial PCR array. Human ICs were enriched by MACS sorting from kidney biopsy and exposed to UPEC vs. saline for one- hour in vitro. Data is presented as volecano plot to identify significant gene expression change in UPEC exposed ICs as compared to saline. Thresholds for the volcano plot were a fold change of >2 and p value of <0.05. Dotted lines represent significance. Upper right quadrant next to dotted lines has genes which are significant and upregulated. Genes listed on lower right are upregulated but not significant. Genes listed in lower left quadrant are down regulated but non-significant. n=3 kidney biopsy/group.