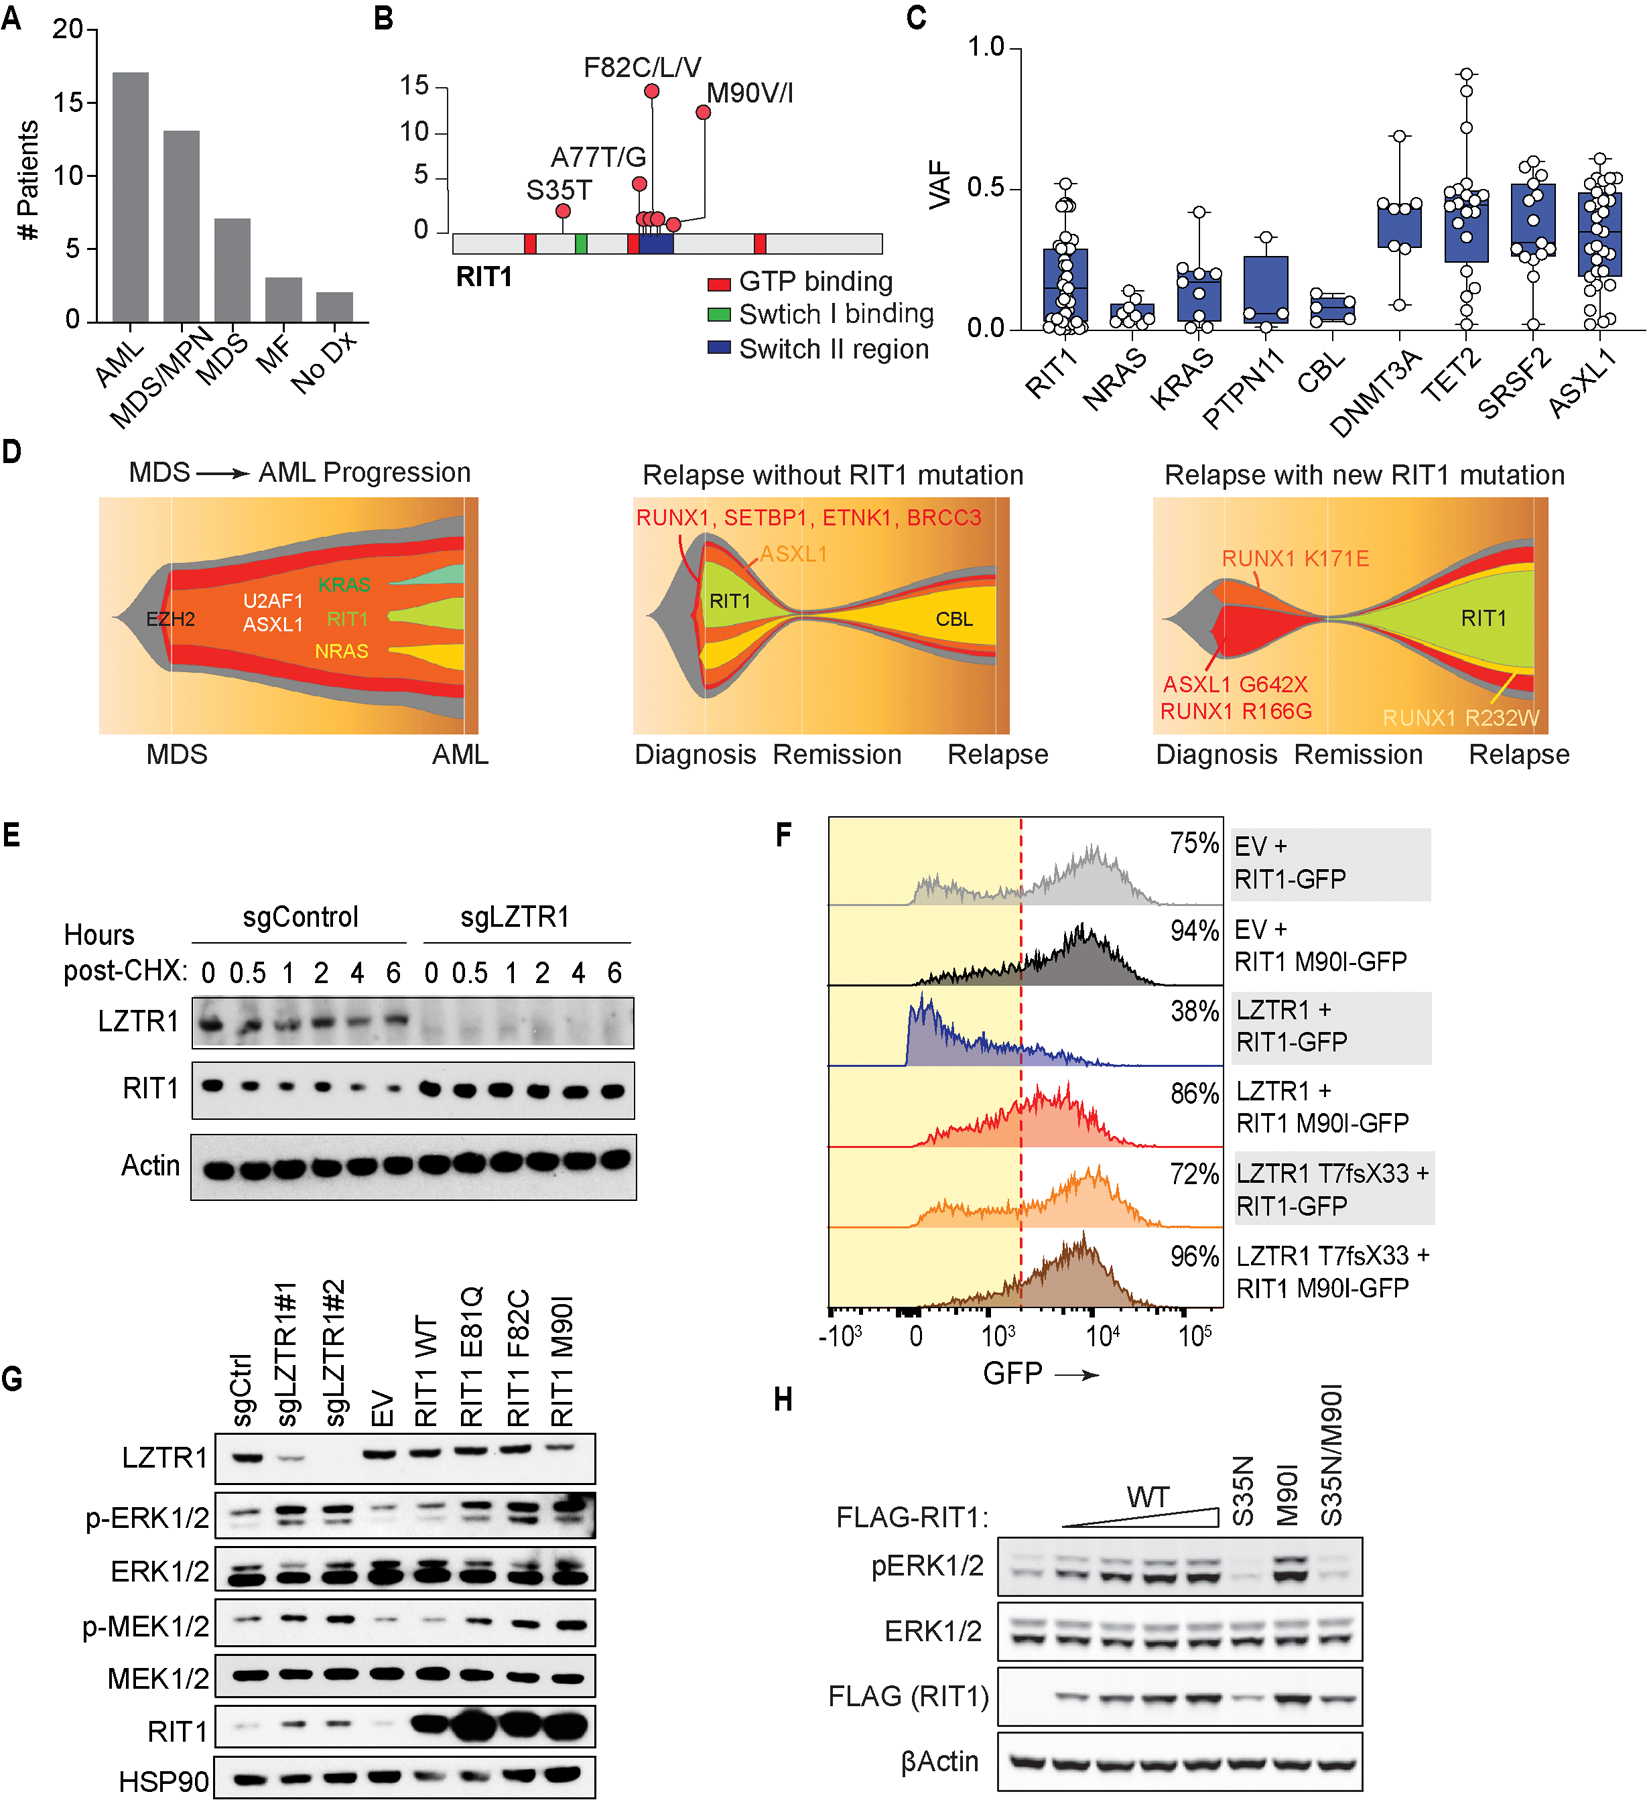
Figure 2. Characterization of RIT1 mutations in patients with hematological malignancies.

(A) Histogram of number of patients with RIT1 mutations based on myeloid malignancy diagnosis. Abbreviations: AML: acute myeloid leukemia; MDS: myelodysplastic syndromes; MDS/MPN: myelodysplastic syndromes/myeloproliferative neoplasms; MF: myelofibrosis; No Dx: no diagnosis. (B) Diagram of location of RIT1 mutations identified. (C) Variant allele frequency (VAF) of mutations in RAS GTPases or regulators of RAS GTP abundance relative to mutations in transcriptional modifiers in myeloid leukemia patients. (D) Fish tail representation plots of VAFs of mutations across serial genomic analysis of three RIT1 mutant patients. (E) Western blot of LZTR1 and RIT1 following cycloheximide (CHX) treatment of TF-1 cells with or without LZTR1 deletion. (F) Representative histograms of GFP in cells encoding wild-type or mutant RIT1 fused to eGFP along with empty vector (EV), wild-type LZTR1, or mutant LZTR1. % of eGFP+ cells indicated. Red dotted line indicates the cutoff for GFP+. (G) Levels of phosphorylated and total MEK1/2 and ERK1/2 as well as RIT1 in TF-1 cells with LZTR1 deletion or expression of empty vector RIT1 wild-type (WT) or mutant cDNAs. (H) Western blot of pERK and total ERK levels in 293T cells transfected with increasing amounts of FLAG-RIT1 wild-type (WT) and mutant cDNAs.
