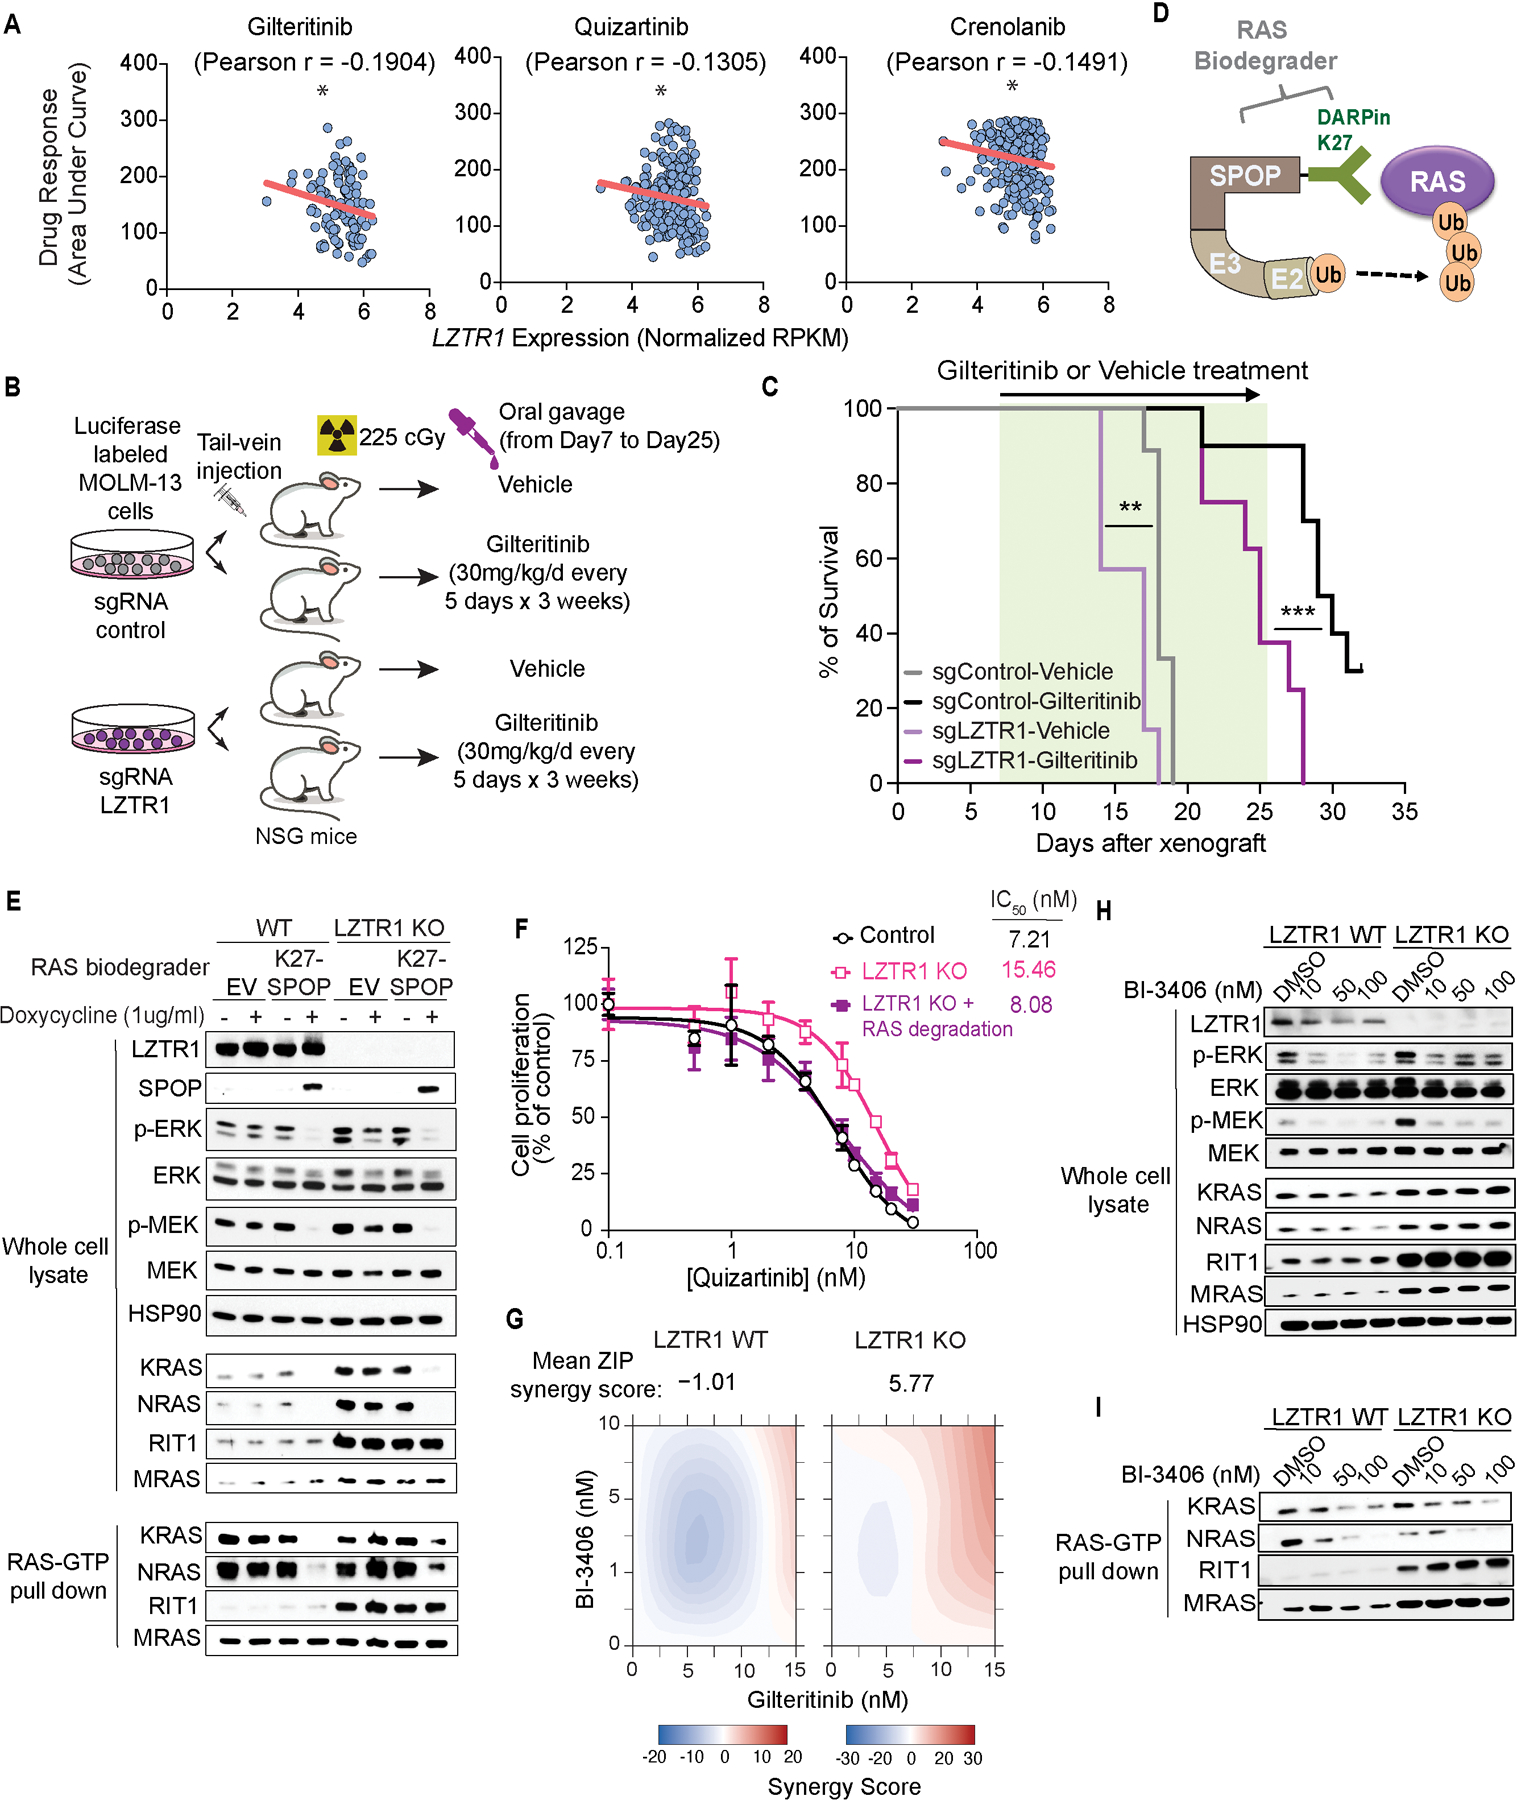
Figure 6. LZTR1-mediated drug resistance can be overcome by modulating RAS-GTP abundance.

(A) Scatter plots of RNA expression levels (shown as normalized RPKM) plotted against drug sensitivity measured ex vivo as area under the curve (AUC) from AML patient samples harboring FLT3-ITD mutation, n ≥ 111. *p<0.05. Pearson’s correlation coefficients are shown as (r) values. Statistical significance is indicated. (B) Schema of MOLM-13 cell line xenograft experiment. Luciferase-expressing MOLM-13 cells treated with anti-LZTR1 or control sgRNAs were systemically engrafted with 1×10⁵ cells/animal via tail-vein injection after sublethal (225 cGy) irradiation. 7 days later, animals were then treated with either vehicle or 30mg/kg/day of gilteritinib via oral gavage. Animals underwent bioluminescence imaging weekly. (C) Kaplan-Meier curve of experiment in (B). n=7–10. **p<0.01, ***p<0.001. (D) Schema of protein-based degrader of RAS proteins. A chimeric protein consisting of a high-affinity target-binding domain for RAS proteins (DARPin K27) is fused to an engineered E3 ligase adapter (SPOP) to confer ubiquitin-mediated degradation of RAS proteins. (E) Western blot demonstrating levels of LZTR1 as well as total and GTP-bound K/N/MRAS and RIT1 in MOLM-13 cells +/− LZTR1 knockout (KO) upon doxycycline-mediated induction of the RAS biodegrader (performed in biological triplicate). (F) 72-hour cell proliferation assay on parental and LZTR1 knockout MOLM-13 cells +/− induction of RAS degradation. Cell viability was measured in triplicate using CellTiter-Glo. (G) 2D synergy plots using Zero interaction potency (ZIP) model of control sgRNA (“WT”) or anti-LZTR1 sgRNA (“LZTR1 KO”) MOLM-13 cells treated for 72 hours with BI-3406 and/or gilteritinib at various concentrations. Western blot demonstrating (H) p-MEK, p-ERK, and total MEK, ERK, K/N/MRAS and RIT1 levels as well as (I) RAS-GTP levels in MOLM-13 cells +/− LZTR1 KO treated with increasing concentration of DMSO or BI-3406 alone 4 hours after drug treatment.
