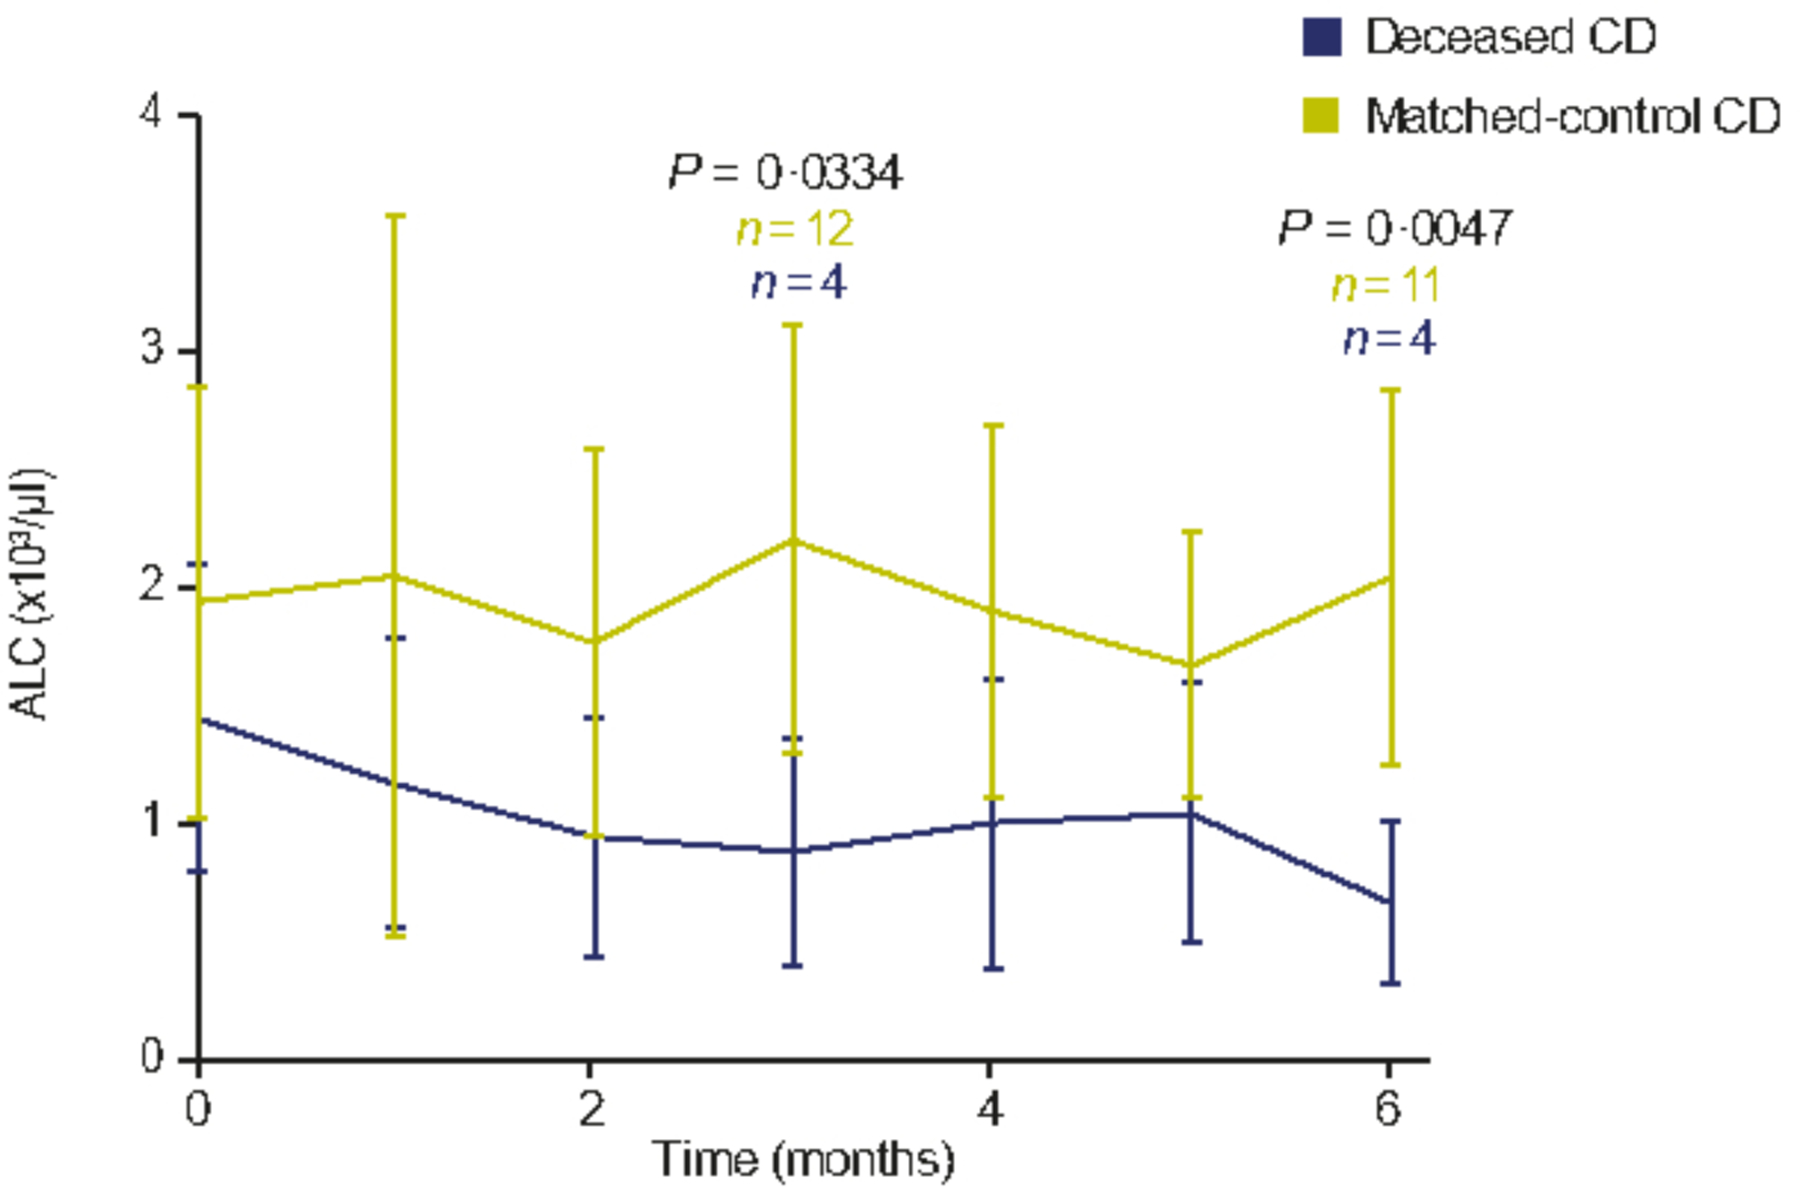
Fig 2.

Repeated-measures linear mixed model for monthly ALC in the deceased CD and matched-control CD cohorts. Values in the graph represent mean ± SD. The values at month 0 show the ALC counts at the time of diagnosis. ALC, absolute lymphocyte count; CD, Castleman disease; SD, standard deviation. Note: P-values changed over time, but only significant time-points have been highlighted.
