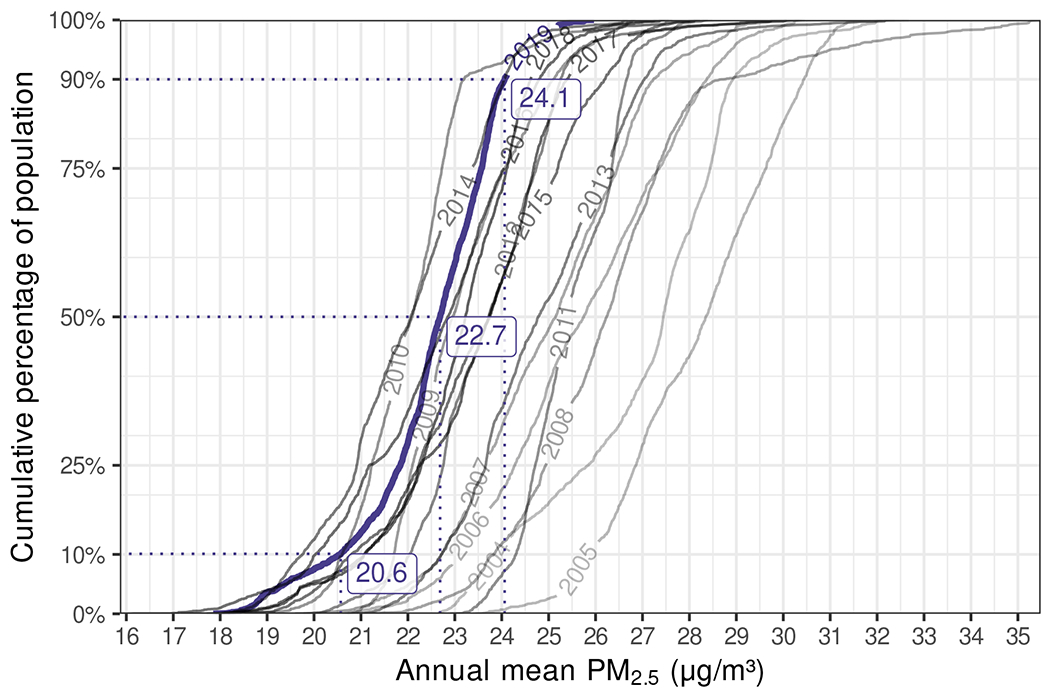
Figure 4.

Population estimated annual average exposures. The figure shows an empirical cumulative distribution curve for each year from 2004 to 2019, generated from our daily mean model and using the 2010 census population density. Specific quantiles are labeled for the year 2019, where only 10% of the population in the study region had an annual average exposure below 20.6 μg/m3.
