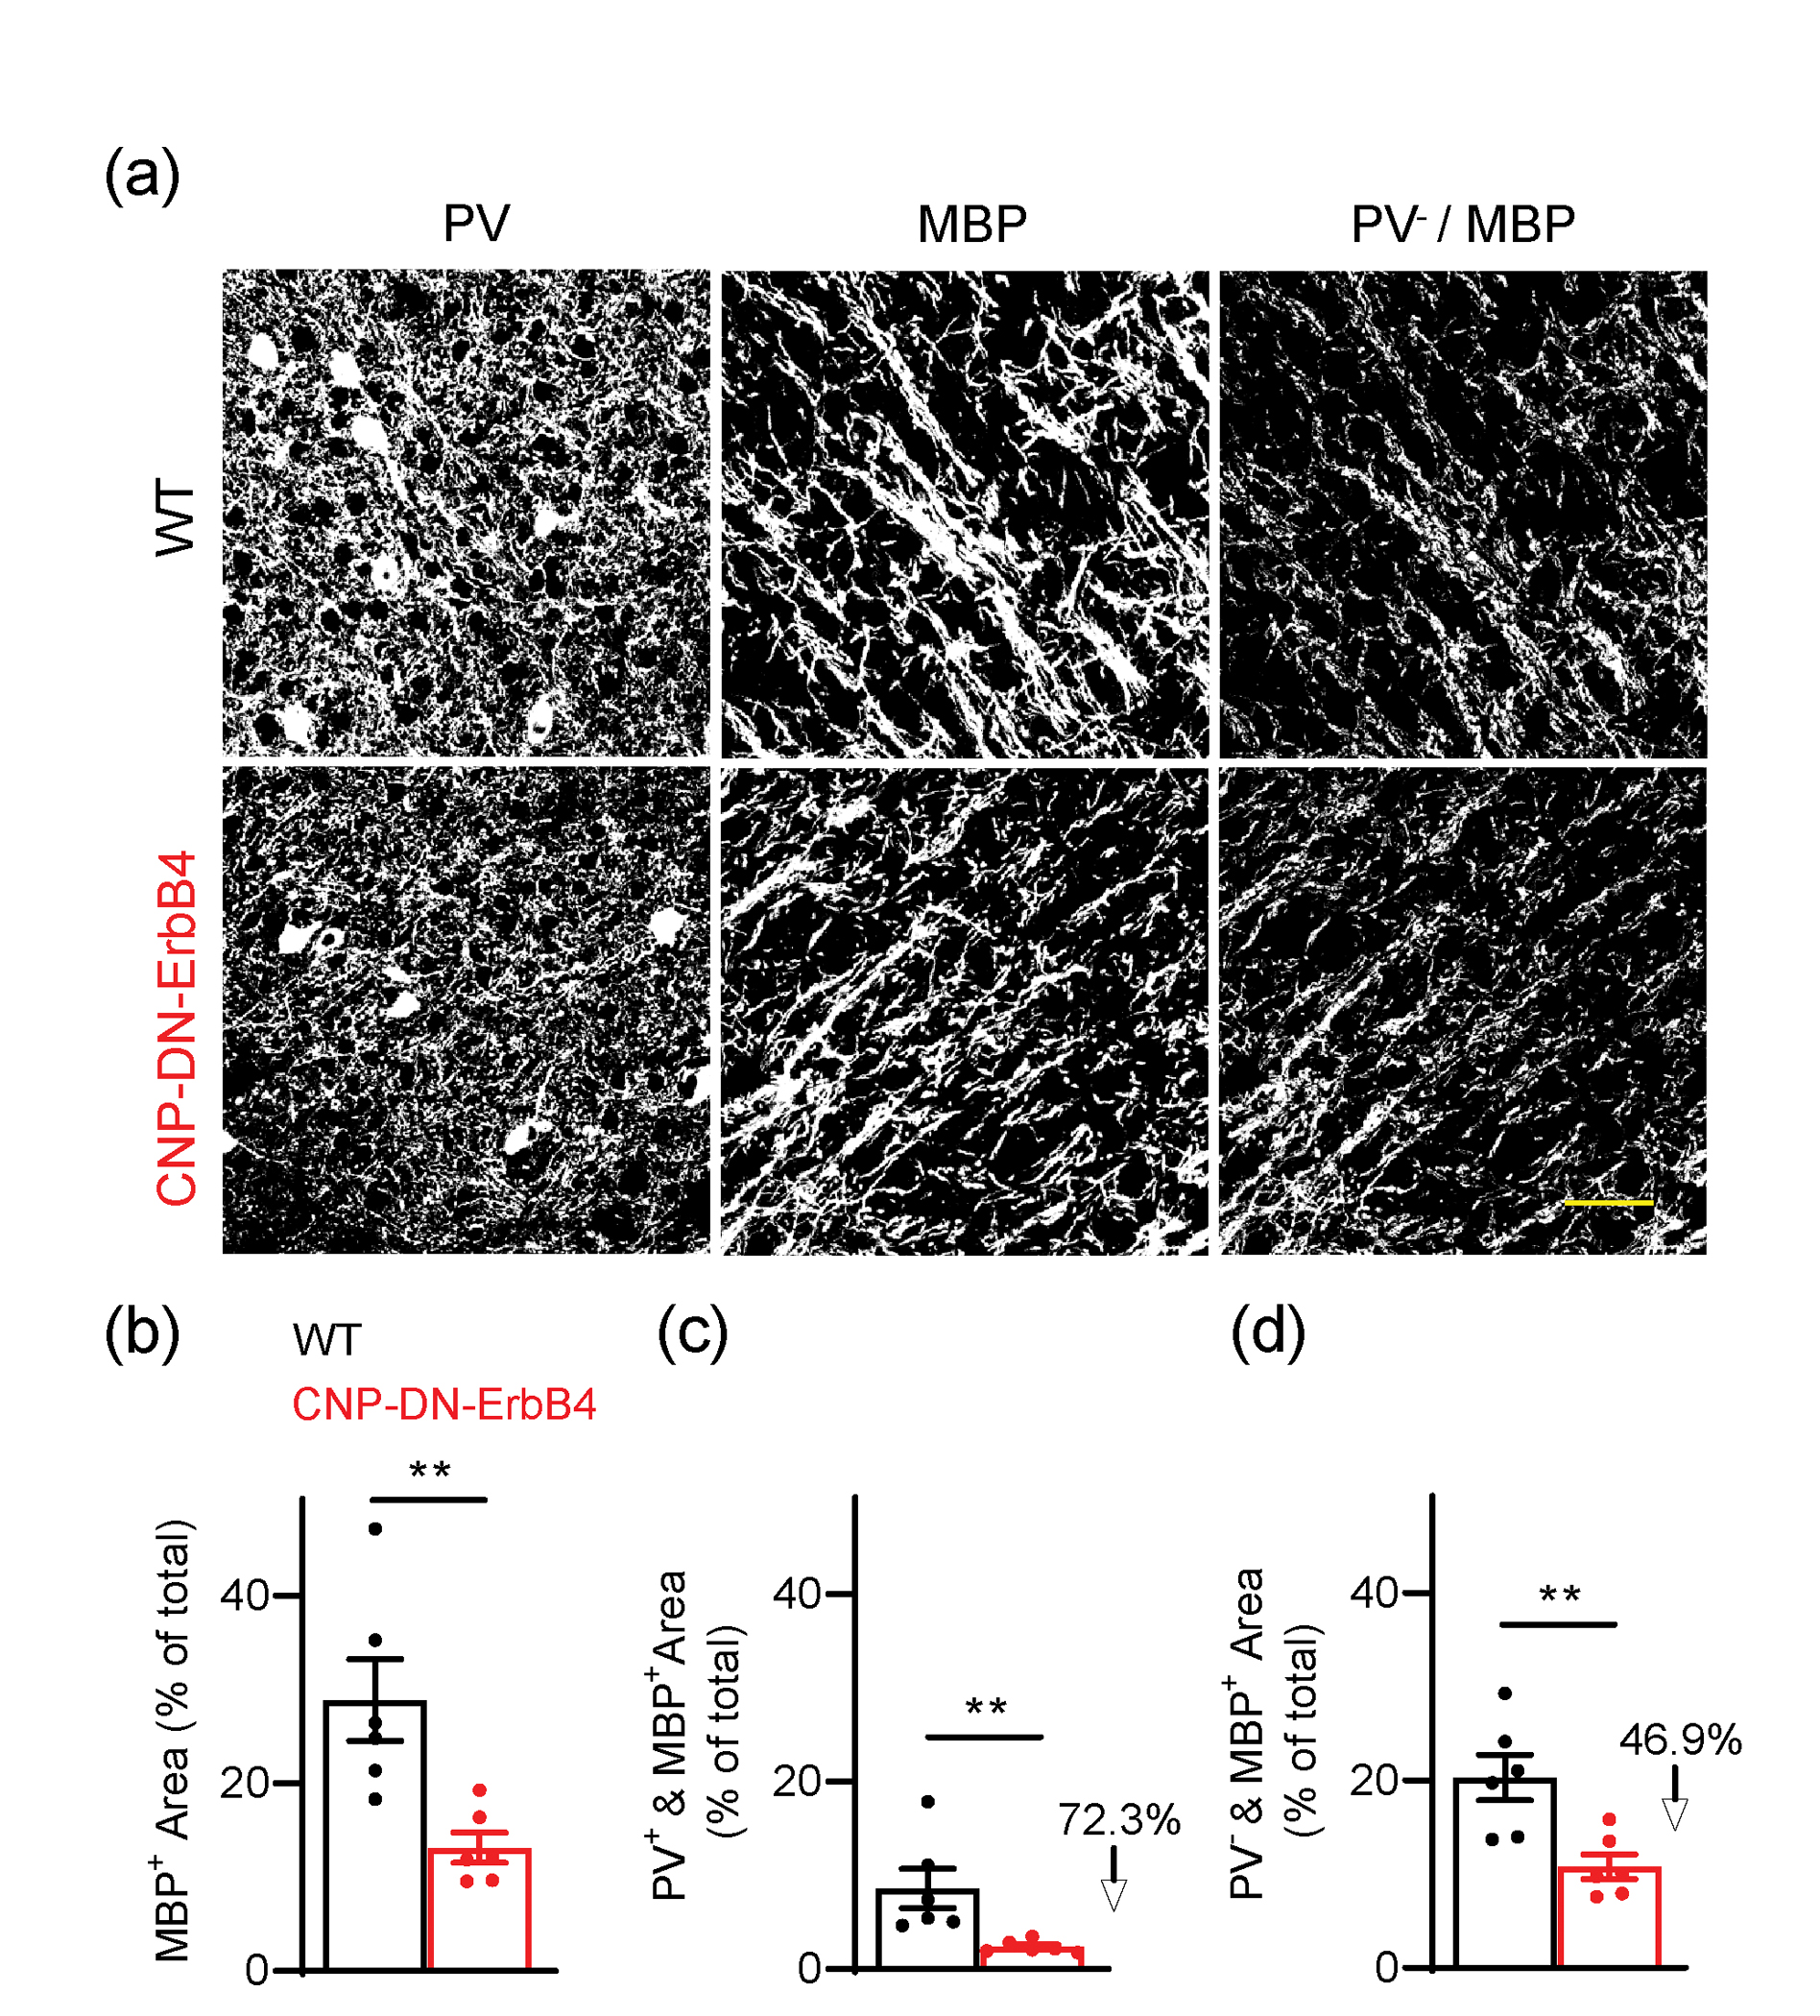
Figure 10: Loss of oligodendrocyte ErbB signaling leads to reduction in A1 MBP immunostaining both associated and not associated with PV immunostaining.

a, Representative photomicrographs of A1 sections from WT and CNP-DN-ErbB4 mice showing the area with PV immunostaining (left), the area with MBP immunostaining (middle) and the MBP+ area not associated with PV staining (right). Scale bar: 20μm.
b, Percent area covered by total MBP signal in A1 of WT (black) and CNP-DN-ErbB4 (red) mice (n = 6; p = 0.0043).
c, Percent area covered by MBP signal associated with PV signal (PV+ & MBP+) in A1 of WT (black) and CNP-DN-ErbB4 (red) mice (n = 6; p = 0.0022).
d, Percent area covered by MBP signal not associated with PV signal (PV− & MBP+) in A1 of WT (black) and CNP-DN-ErbB4 (red) mice (n = 6; p = 0.0087).
Mann-Whitney test was performed. Data are expressed as mean ± SEM.
