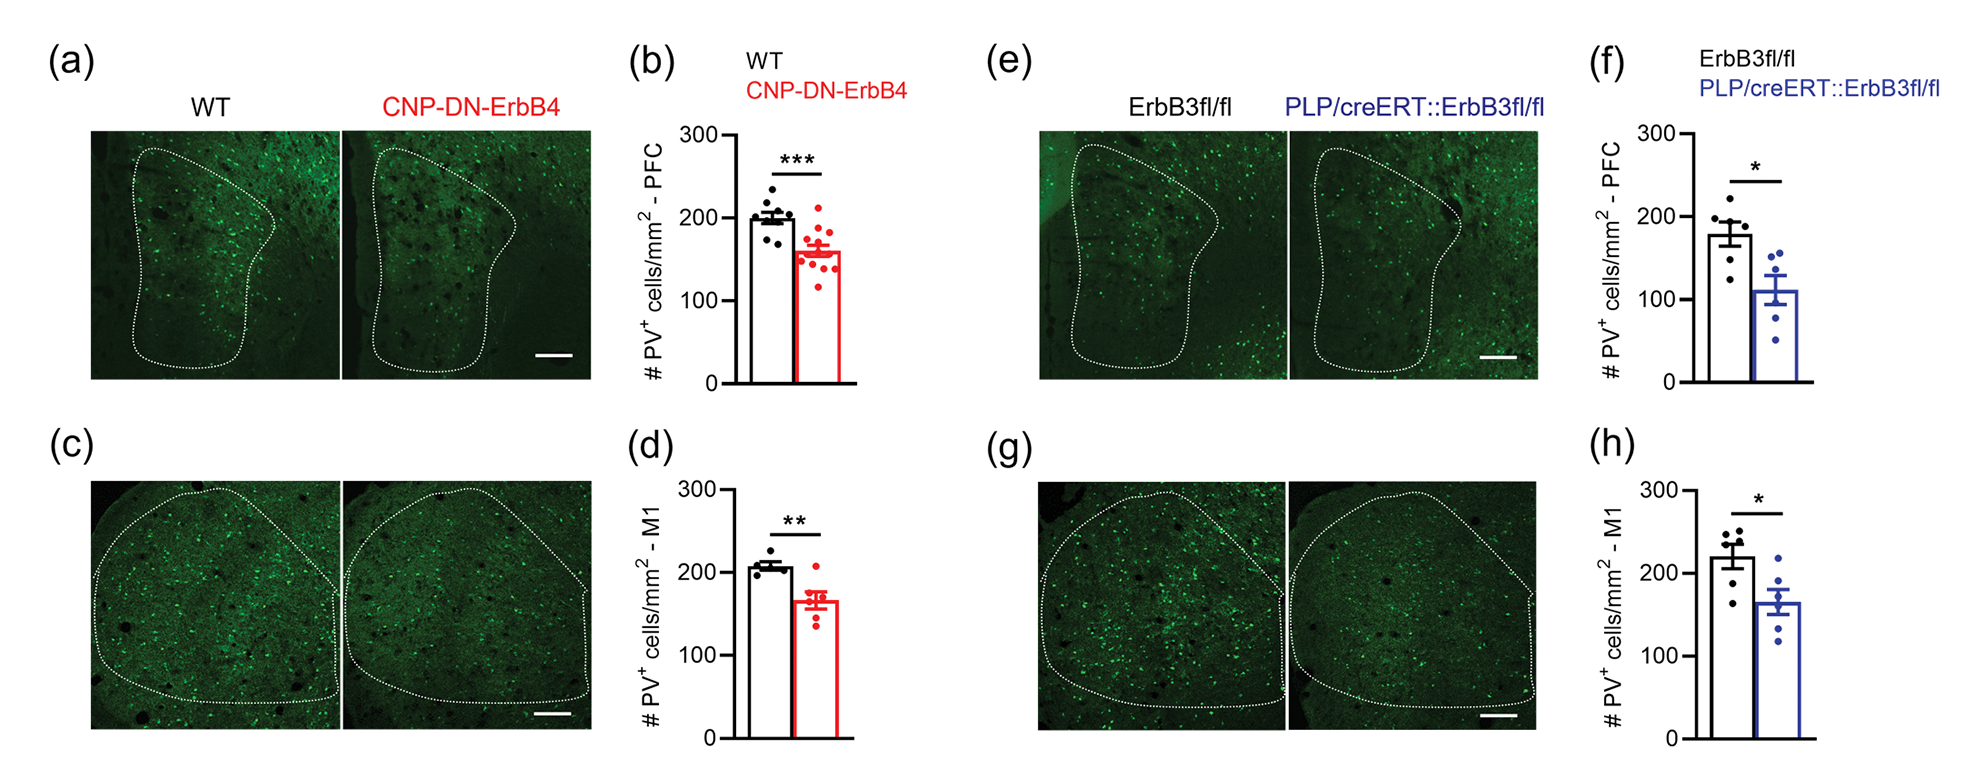
Figure 13: Loss of oligodendrocyte ErbB signaling by expression of DN-ErbB4 or ErbB3 KO leads to reduced PV cell density in other brain areas such as prefrontal cortex and primary motor cortex.

a, Representative photomicrographs of prefrontal cortex (PFC) sections from WT and CNP-DN-ErbB4 mice showing PV+ cells (green). Scale bar: 100μm.
b, PFC PV+ cell density is reduced in PFC of CNP-DN-ErbB4 mice (n = 9 – 13; p = 0.0009).
c, Representative photomicrographs of primary motor cortex (M1) sections from WT and CNP-DN-ErbB4 mice showing PV+ cells (green). Scale bar: 100μm.
d, PFC PV+ cell density is reduced in M1 of CNP-DN-ErbB4 mice (n = 5 – 6; p = 0.0083).
e, Representative photomicrographs of prefrontal cortex (PFC) sections from WT and PLP/creERT::ErbB3fl/fl mice showing PV+ cells (green). Scale bar: 100μm.
f, PFC PV+ cell density is reduced in PFC of PLP/creERT::ErbB3fl/fl mice (n = 6; p = 0.0411).
g, Representative photomicrographs of primary motor cortex (M1) sections from WT and PLP/creERT::ErbB3fl/fl mice showing PV+ cells (green). Scale bar: 100μm.
h, PFC PV+ cell density is reduced in M1 of PLP/creERT::ErbB3fl/fl (n = 6; p = 0.0260).
Mann-Whitney test was performed. Data are expressed as mean ± SEM.
