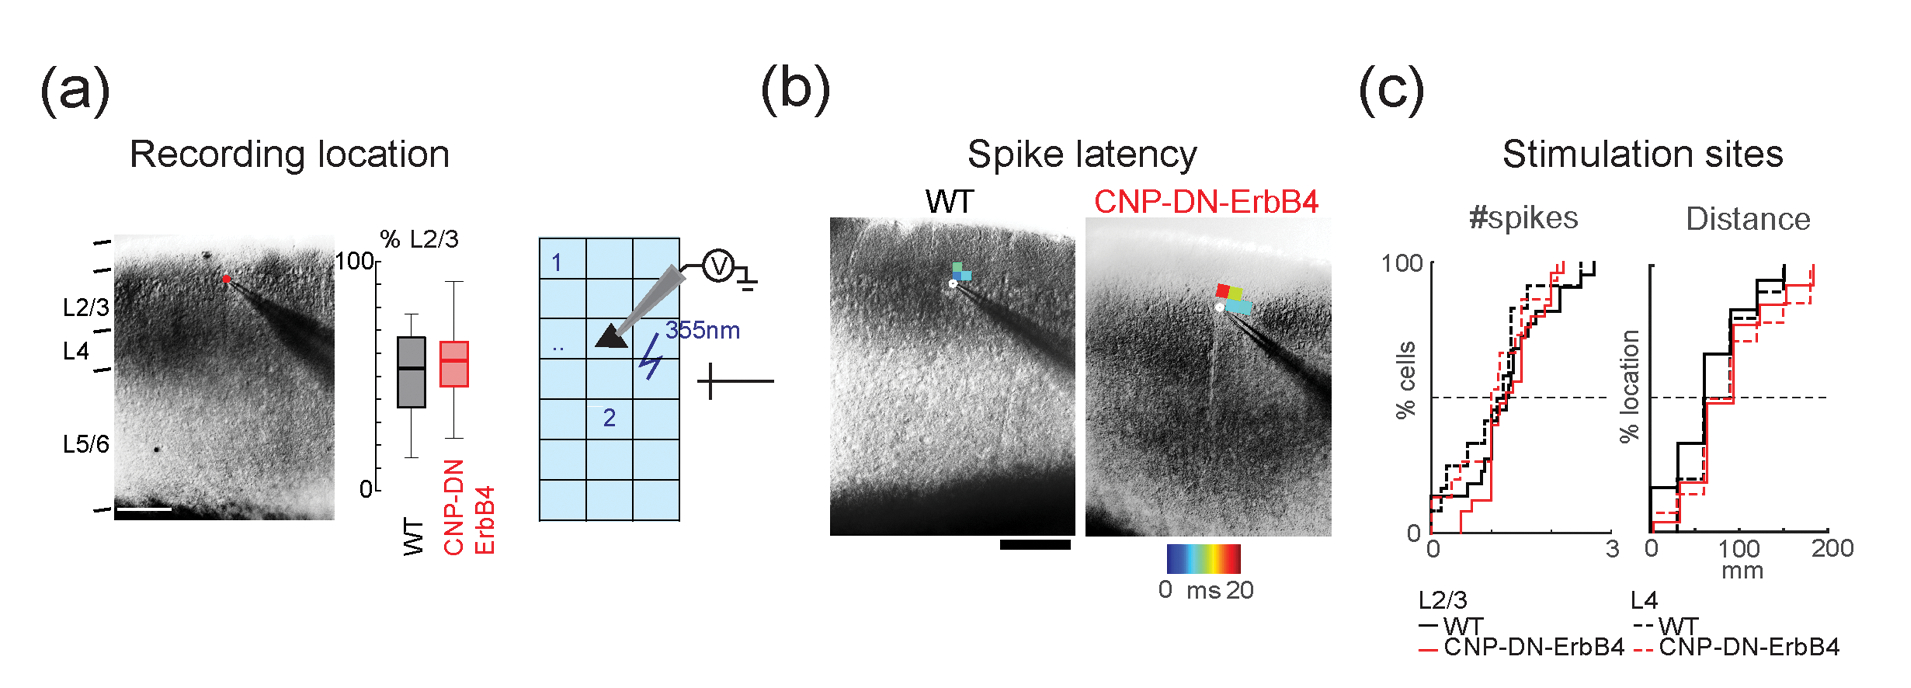
Figure 2: Sensitivity to photo released glutamate in Layer 2/3 neurons is normal in A1 of CNP-DN-ErbB4 mice.

a, Left, Infrared image of cortical field with patch pipette on a. Scale bar is 200 μm. Cortical layers are identified based on the DIC image. Right, Position of recorded cells within Layer 2/3. Plotted are the relative positions within Layer 2/3 for WT (black) and CNP-DN-ErbB4 (red) mice. 0 refers to the border with Layer 4 and 100 refers to the border with Layer 1.
b, Left, Graphic illustration on how cell attach LSPS experiments were performed. The cortical fields were divided into approximately 30 by 25 grids. UV laser targets stimulation sites in a grid in a pseudorandom pattern to make sure that two nearby locations will not be stimulated sequentially to avoid adaptation. Cells under laser activation sites could be activated and generate action potentials (APs). Right, Cell attached recordings on Layer 2/3 and 4 cells show areas that evoke action potentials. Maps show first spike latencies encoded by color and overlaid on infrared images.
c, Cumulative distributions of number of spikes (Left) and distances from locations that resulted in APs to the soma of L2/3 (solid) and L4 (dashed) cells for both WT (black) and CNP-DN-ErbB4 (red) mice.
