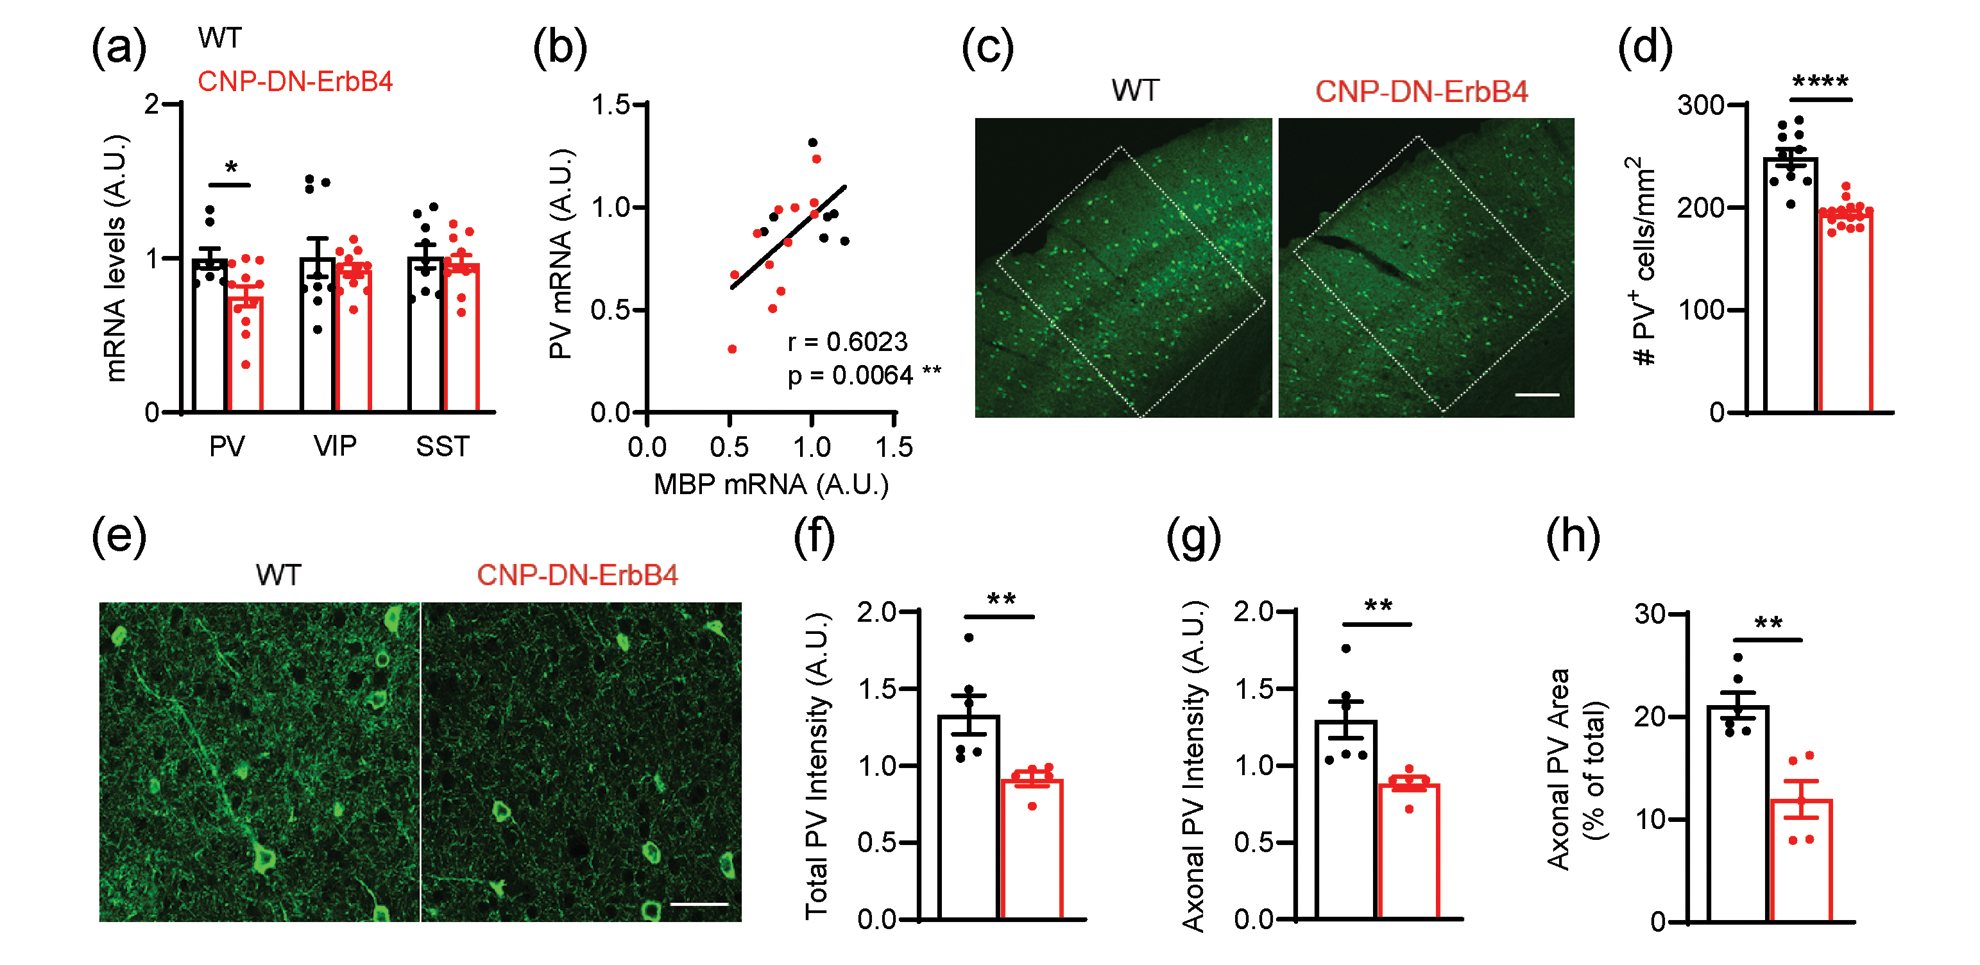
Figure 7: Loss of oligodendrocyte ErbB signaling leads to reduced A1 PV+ cell density and PV mRNA levels.

a, mRNA levels for parvalbumin (PV), vasoactive intestinal peptide (VIP) and somatostatin (SST) in the A1 of WT (black) and CNP-DN-ErbB4 (red) mice. PV mRNA levels are reduced in A1 of CNP-DN-ErbB4 mice (n = 8 – 11; p = 0.0290) whereas no changes are observed in VIP (p = 0.51) and STT (p = 0.6301) mRNA.
b, PV mRNA levels correlate with MBP mRNA levels in A1 (WT: black dots; CNP-DN-ErbB4: red dots; Pearson’s correlation r = 0.6023; p = 0.0064)
c, Representative photomicrographs of A1 sections from WT and CNP-DN-ErbB4 mice showing PV+ cells (green). Scale bar: 100μm.
d, A1 PV+ cell density is reduced in CNP-DN-ErbB4 mice (n = 10 – 14; p <0.0001).
e, Representative photomicrographs of A1 sections from WT and CNP-DN-ErbB4 mice showing PV+ neurons and axons (green). Scale bar: 20μm.
f, Quantification of total PV staining intensity (cell bodies + axons) in WT (black) and CNP-DN-ErbB4 (red) mice (n = 5 – 6, p = 0.0043). A.U.: arbitrary units.
g, Quantification of axonal PV staining intensity (total PV intensity – cell body PV intensity) in WT (black) and CNP-DN-ErbB4 (red) mice (n = 5 – 6, p = 0.0043). A.U.: arbitrary units.
h, Quantification of the area covered by PV+ axons in WT (black) and CNP-DN-ErbB4 (red) mice (n = 5 – 6; p = 0.0087). A.U.: arbitrary units.
Unpaired two-tailed Student’s t test or Mann-Whitney test were performed. Data are expressed as mean ± SEM.
