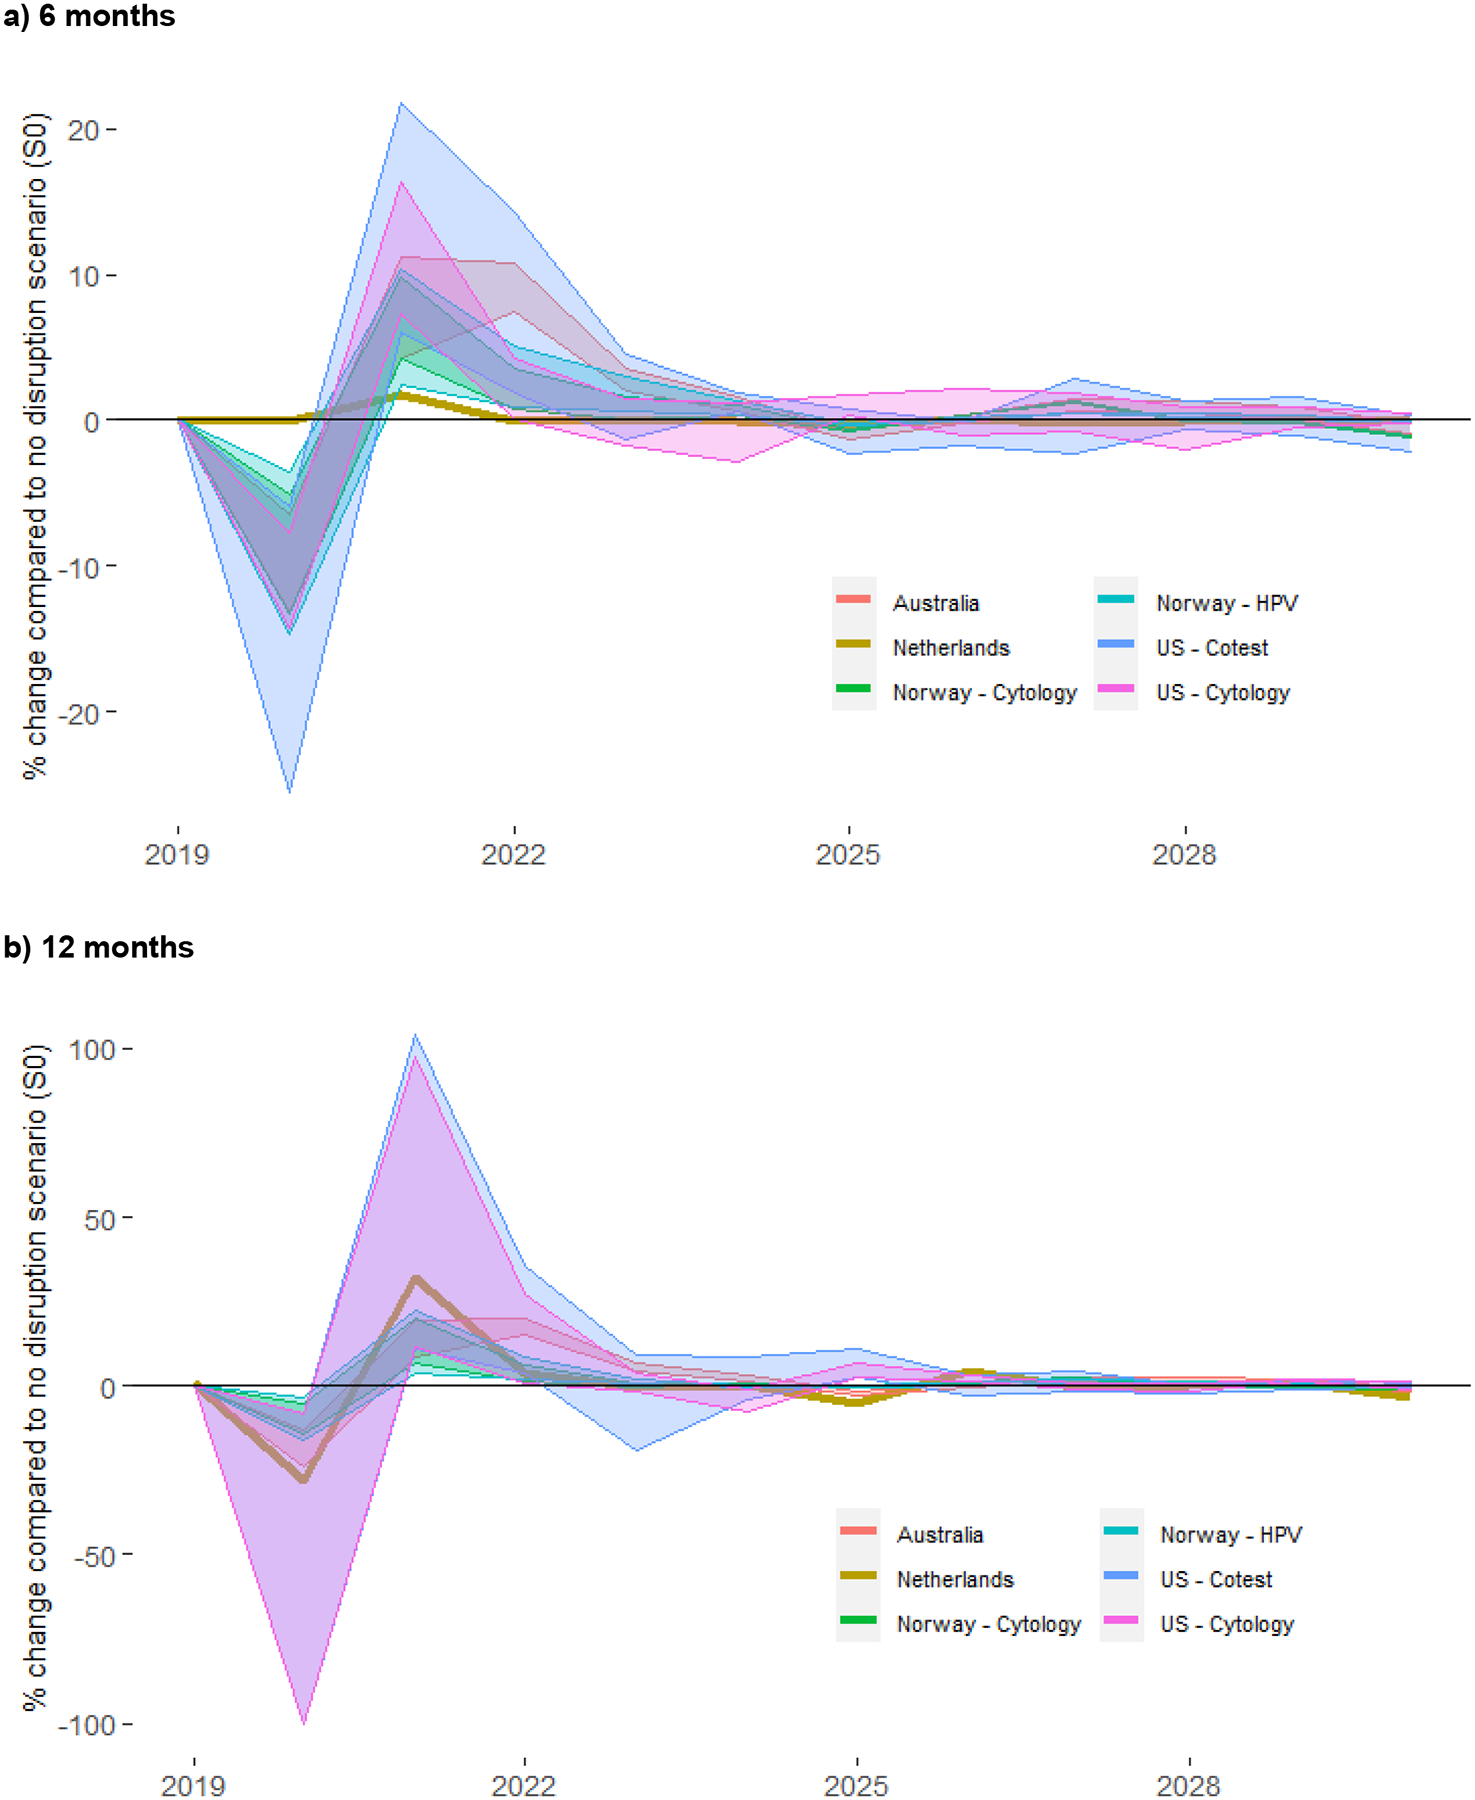
Figure 1:

percentage change in total cancer cases over 2020–2030, by year and setting
6 months chart represents the range across scenarios S1 to S3 and the 12 months chart represents the range across scenarios S5 to S7 (in both cases, the percent change is relative to S0). Results for the US represent the range across the two included models (Harvard and Policy1-Cervix). Model-specific US results are included in an Appendix (Figure A3). Results in Table 3 represent the aggregated percentage change compared to S0 across the period 2020–2030.
