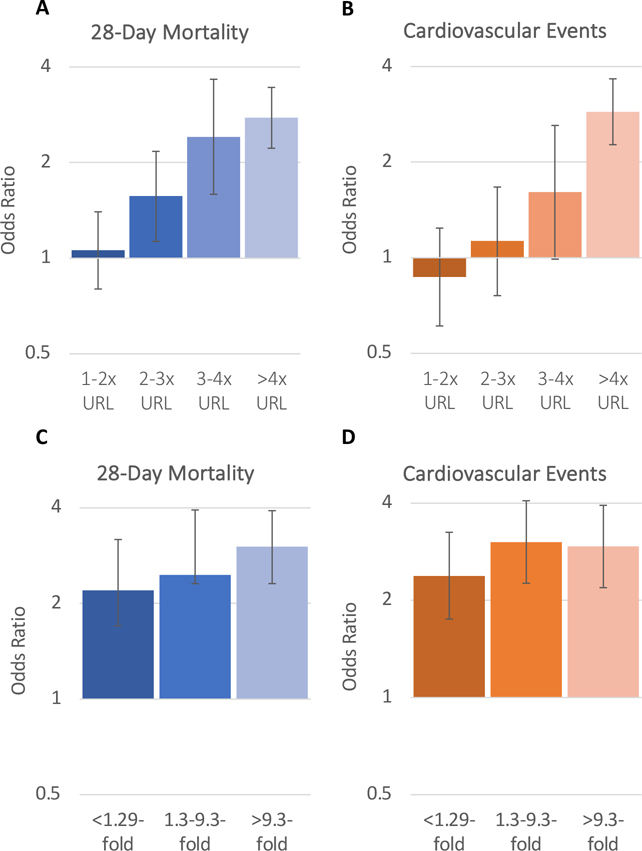
Figure 3. Associations between troponin elevation on ICU admission and troponin fold change during hospitalization with 28-day mortality (A,C) and cardiovascular events (B,D).
Bar graphs depicting the odds ratios and 95% confidence intervals for 28-day mortality (Panel A) and cardiovascular events (Panel B) based on acute cardiac injury on ICU admission categorized as troponin elevation 1–2x, 2–3x, 3–4x, and > 4x the URL vs. no acute cardiac injury (reference) based on model 3. Panels C and D depict odds ratios and 95% confidence intervals based on the absolute fold change in troponin during hospitalization categorized as an absolute fold change of <1.29, 1.3–9.3%, and >9.3% compared to patients with no elevated troponin measurements during hospitalization (reference) for 28-day mortality (Panel C) and cardiovascular events (Panel D) based on model 3. Abbreviations: ICU, intensive care unit; URL, upper reference limit of normal

