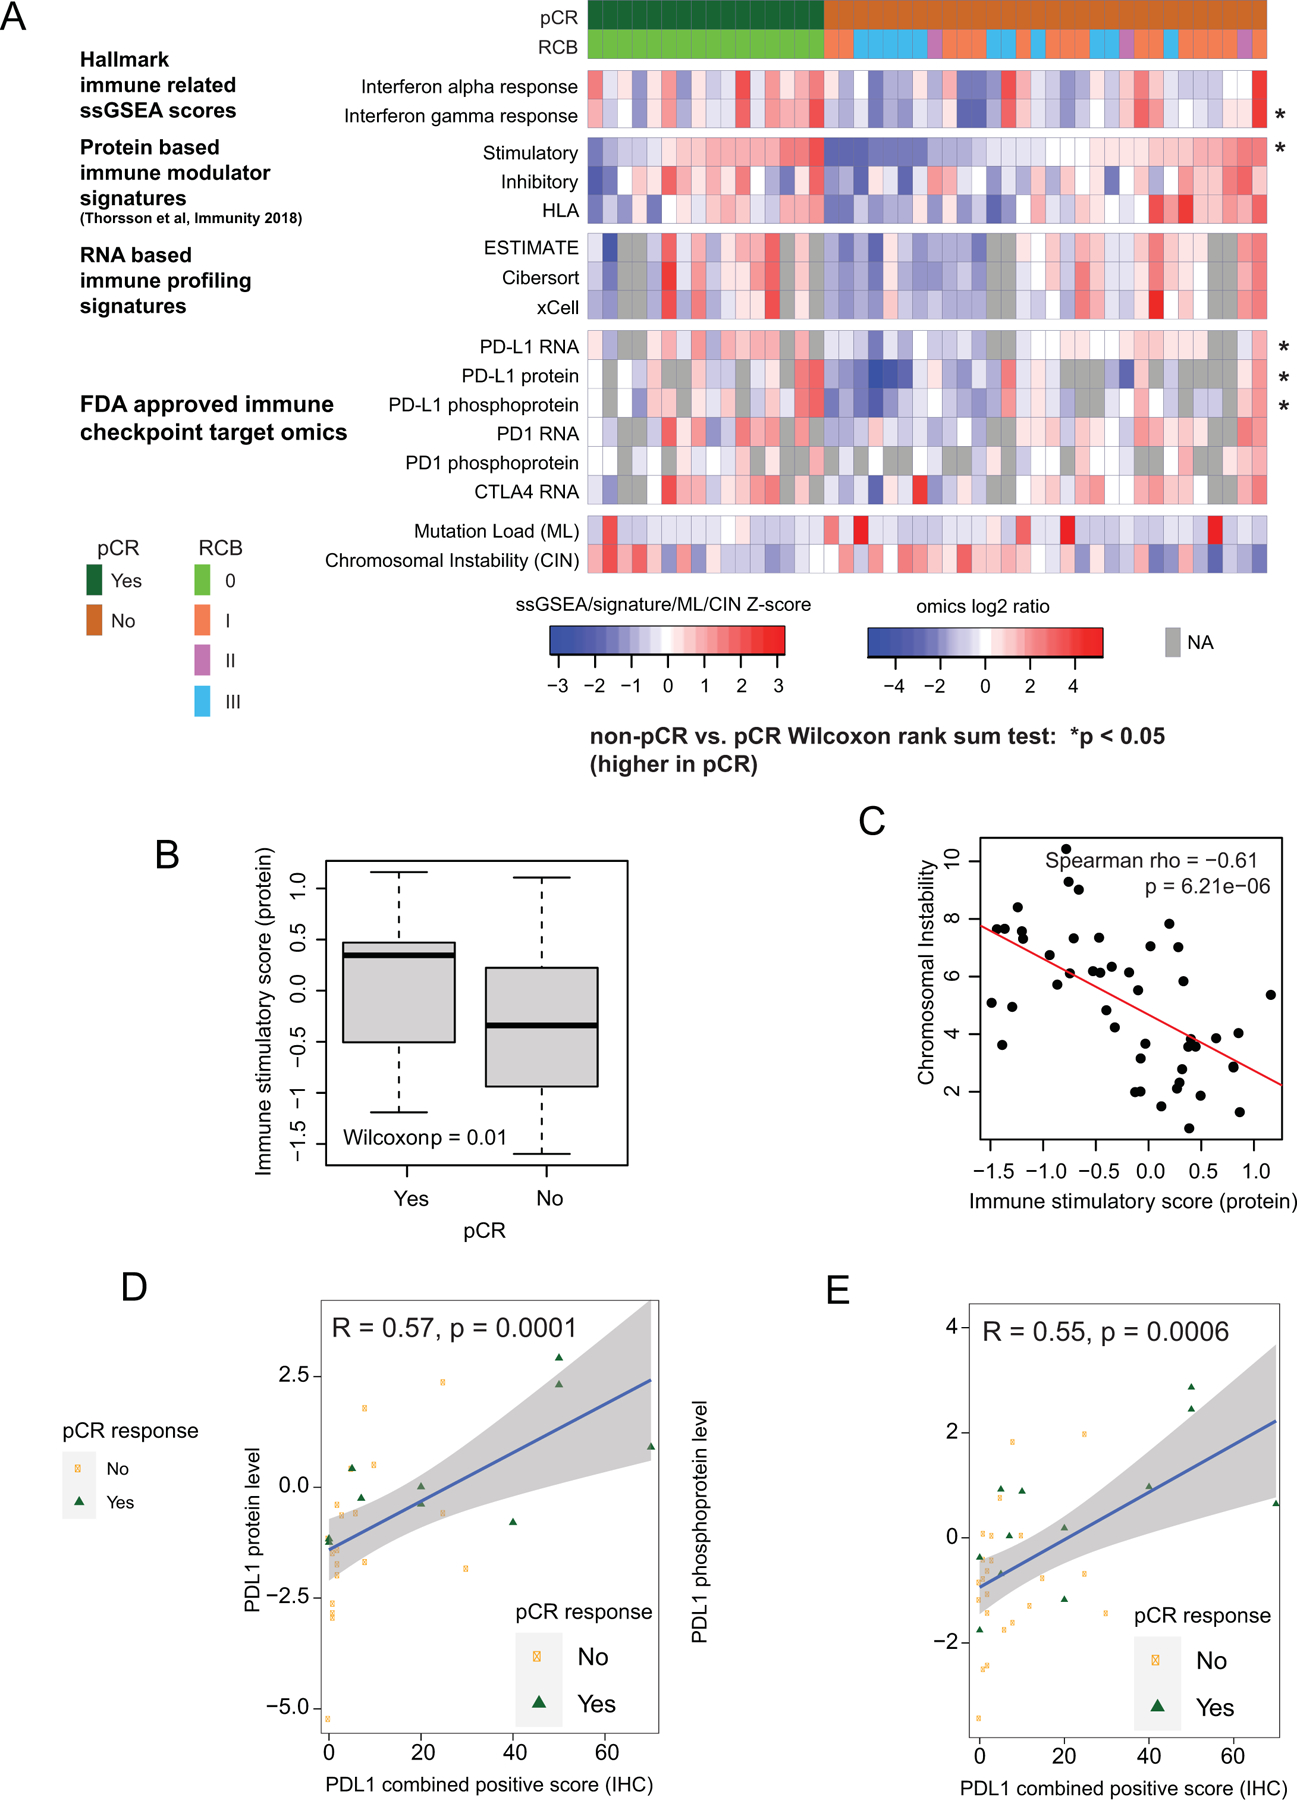
Fig 2: Proteogenomic features associated with pCR in TNBC tumors.

A) Proteogenomic features associated with the immune microenvironment are elevated in pCR tumors relative to non-pCR tumors. Heatmap shows protein-based Hallmark single sample GSEA (ssGSEA) scores, protein-based immune modulator (IM) scores, RNA-based immune profiles, and proteogenomic features for immune checkpoint genes that are targets of FDA-approved inhibitors. Within each group (pCR and non-pCR), samples are ordered by increasing immune stimulatory score. Asterisks indicate p<0.05 by Wilcoxon rank sum test comparing non-pCR to pCR tumors.
B) The protein based immune stimulatory score is significantly higher in pCR tumors than non-pCR tumors (p=0.01, Wilcoxon rank sum test). Boxplots show interquartile range (IQR) with median marked in center. Whiskers indicate 1.5x IQR.
C) The immune stimulatory score is negatively correlated to chromosomal instability index (CIN; Spearman Rho = −0.612, p = 6.2e-6). Scatter plot shows immune stimulatory score on the x-axis and CIN on the y-axis.
D-E) Scatter plots showing correlation between PDL1 IHC levels with PDL1 protein (D) and phosphoprotein levels (E). pCR cases are shown in green and non-pCR in orange.
