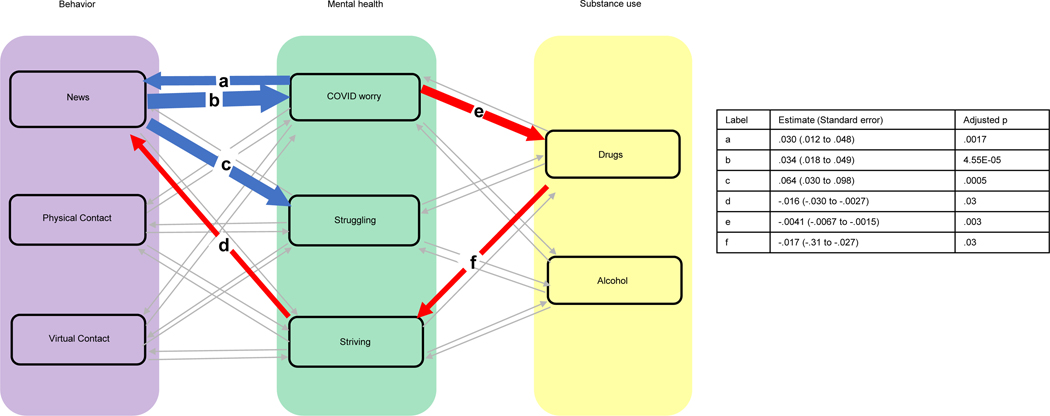
Figure 2. Cross-lagged effects between mental health and both behavior (contact and news/media consumption) and substance use.
Significant positive lags are in blue; negative lags in red. Thickness of the connecting lines is proportional to the –log10 FDR p value. Values for the paths a,b,c,d,e,f, are given in the table.

