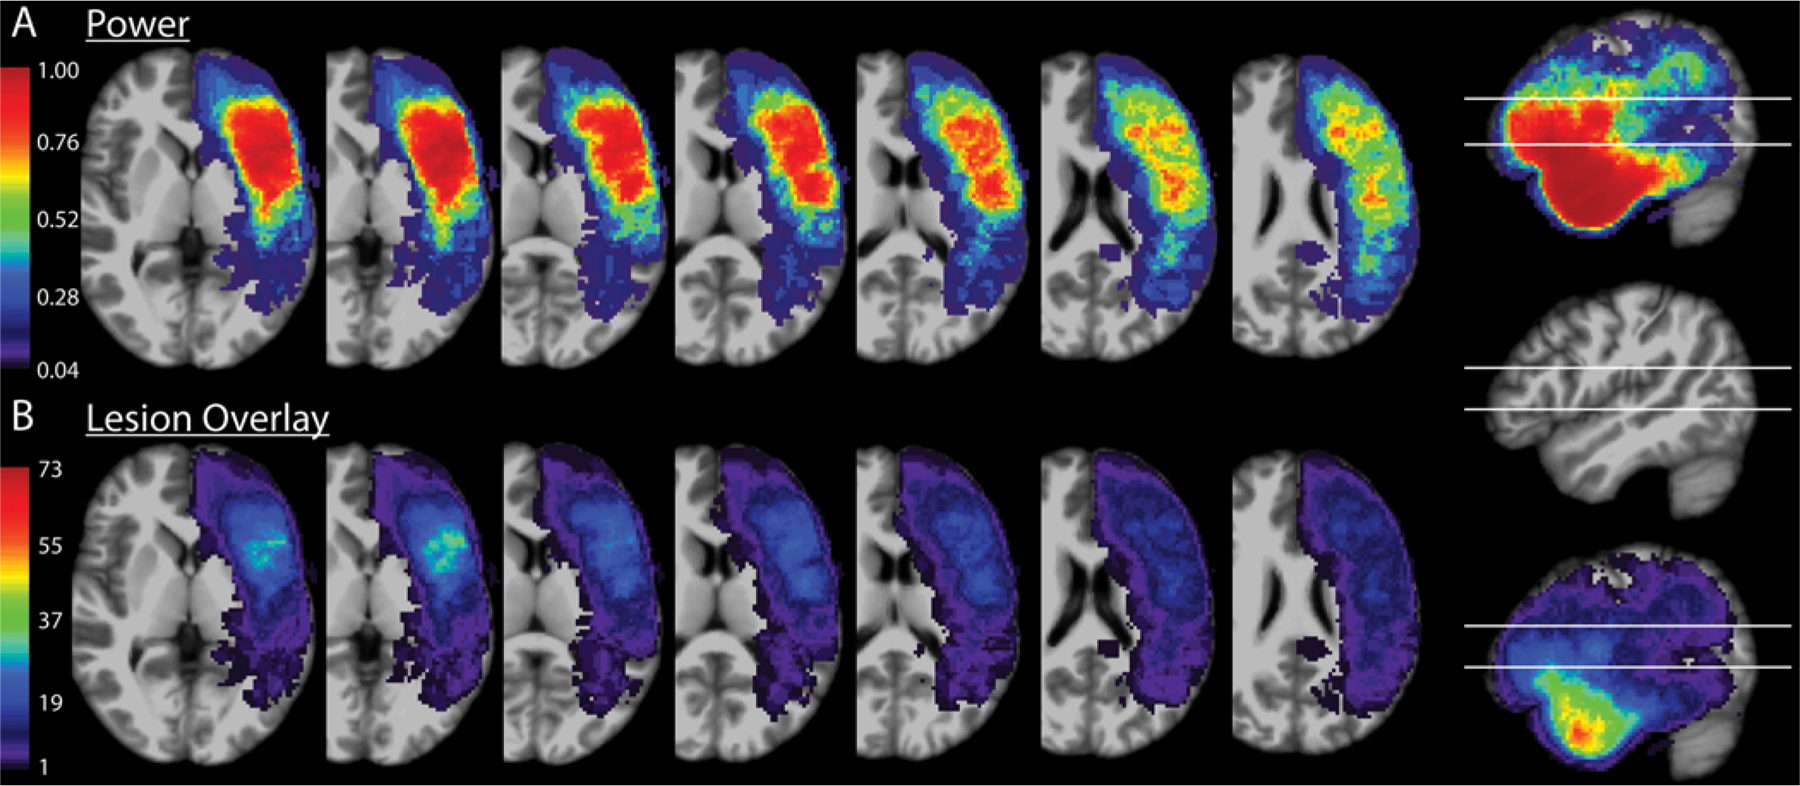
FIG. 2.

VLSM power and overlay. A: Axial cuts through areas of interest on the MNI brain, ranging from inferior (left) to superior (right), overlaid with the power calculated by the VLSM algorithm. The sagittal cut to the far right shows the inferior and superior margins of the axial slices depicted in the sagittal plane. B: Axial cuts of the MNI brain at the same levels as in panel A, overlaid with a lesion heat map with each pixel’s color corresponding to the number of resections overlapping with that area of space. The sagittal cut to the far right shows the inferior and superior margins of the axial slices depicted in the sagittal plane.
