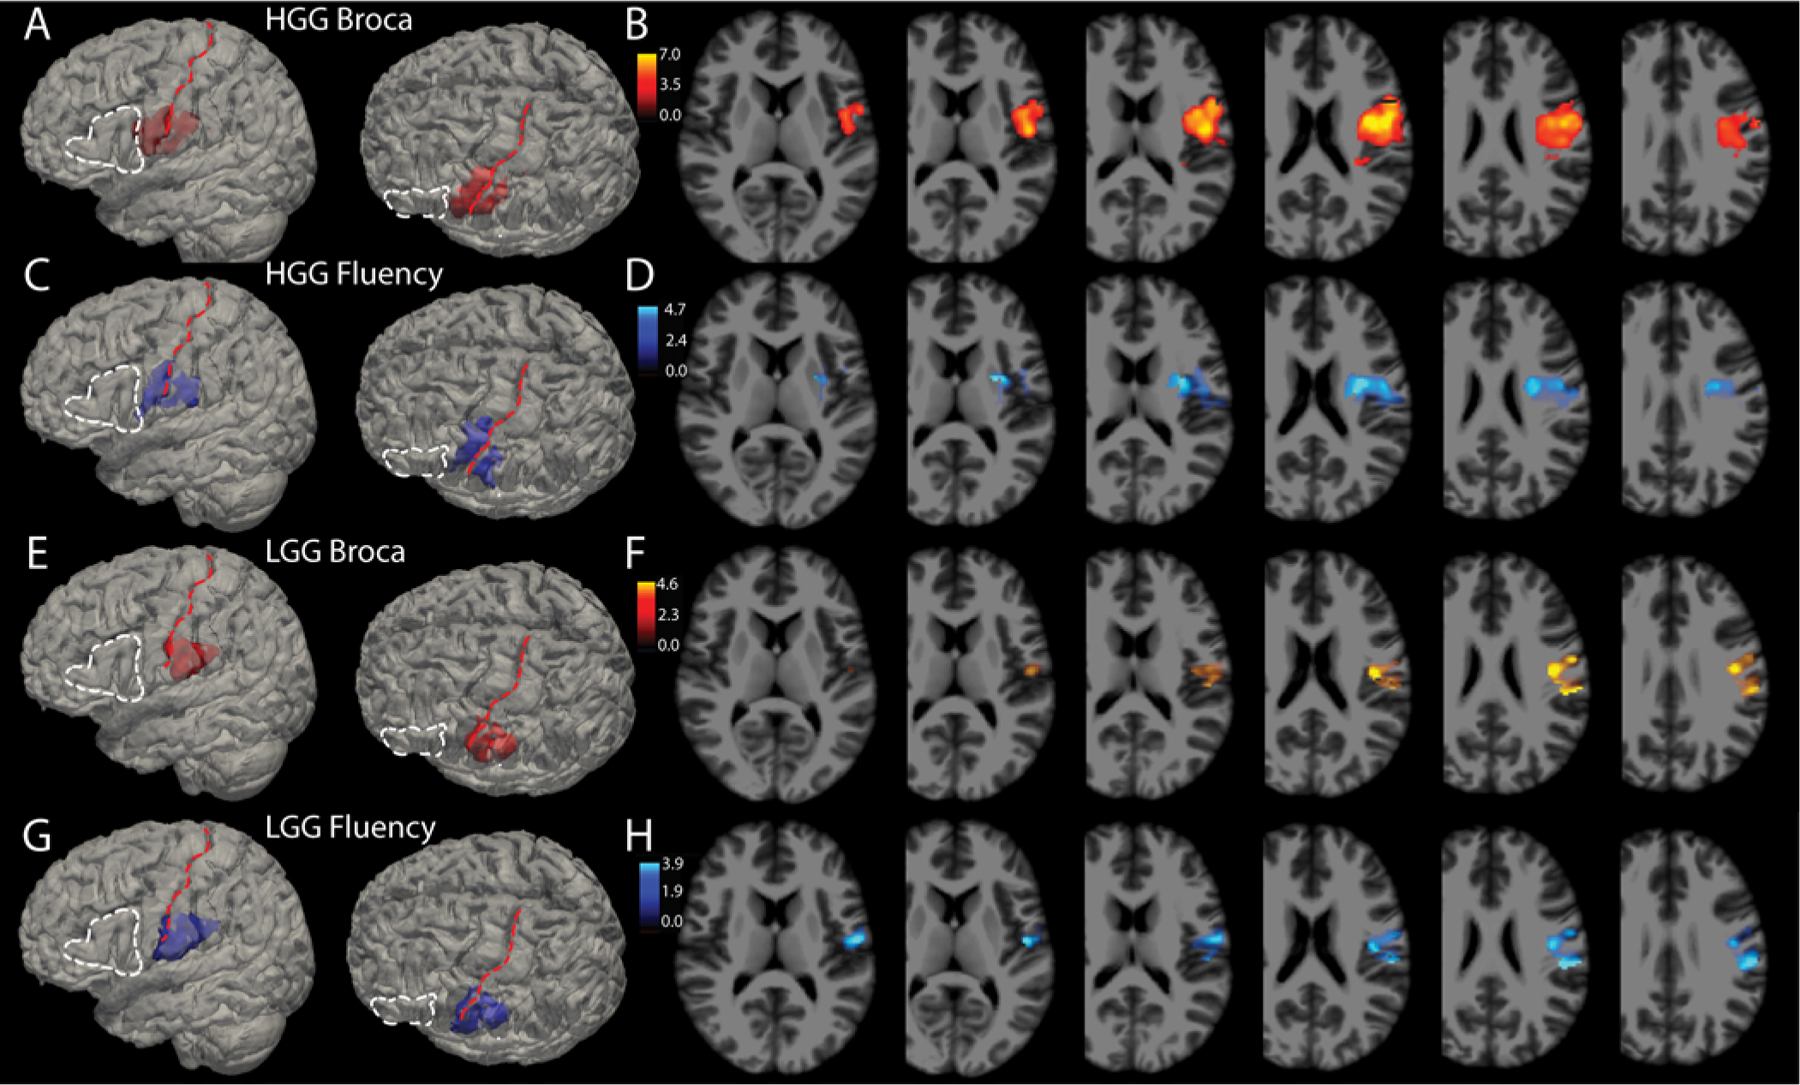
FIG. 4.

Broca’s aphasia and fluency deficits by pathology. Glioma resections made up 83% of this cohort and it is possible that intrinsic differences among these tumors, specifically HGG (WHO grade III or IV) versus LGG (WHO grade I or II), might influence the results. A: A total of 142 HGGs were analyzed using VLSM for association with Broca’s aphasia on a binary scale (yes or no). For anatomical reference, the white dashed line outlines Broca’s area and the red dashed line lies over the central sulcus. Voxels in red in this panel show the 3D reconstruction of voxels meeting the p < 0.001 threshold. B: Axial slices through the t-maps of the voxels depicted in panel A, windowed for t-scores corresponding to p values < 0.001. C and D: 3D reconstructions (C) and 2D cuts (D) through t-maps of voxels associated with reductions in fluency scores independent of WAB diagnosis (i.e., without regard to WAB diagnosis of Broca’s aphasia). E: A total of 97 LGGs were analyzed using VLSM for association with Broca’s aphasia on a binary scale. Voxels in red in this panel show the 3D reconstruction of voxels meeting the p < 0.001 threshold. F: Axial slices through the t-maps of the voxels depicted in panel A, windowed for t-scores corresponding to p values < 0.001. G and H: 3D reconstructions (G) and 2D cuts (H) through t-maps of voxels associated with reductions in fluency scores for a p < 0.005 in the LGG cohort.
