
Figure 2: Identification of samples with Outlier Methylation Phenotype (OMP).
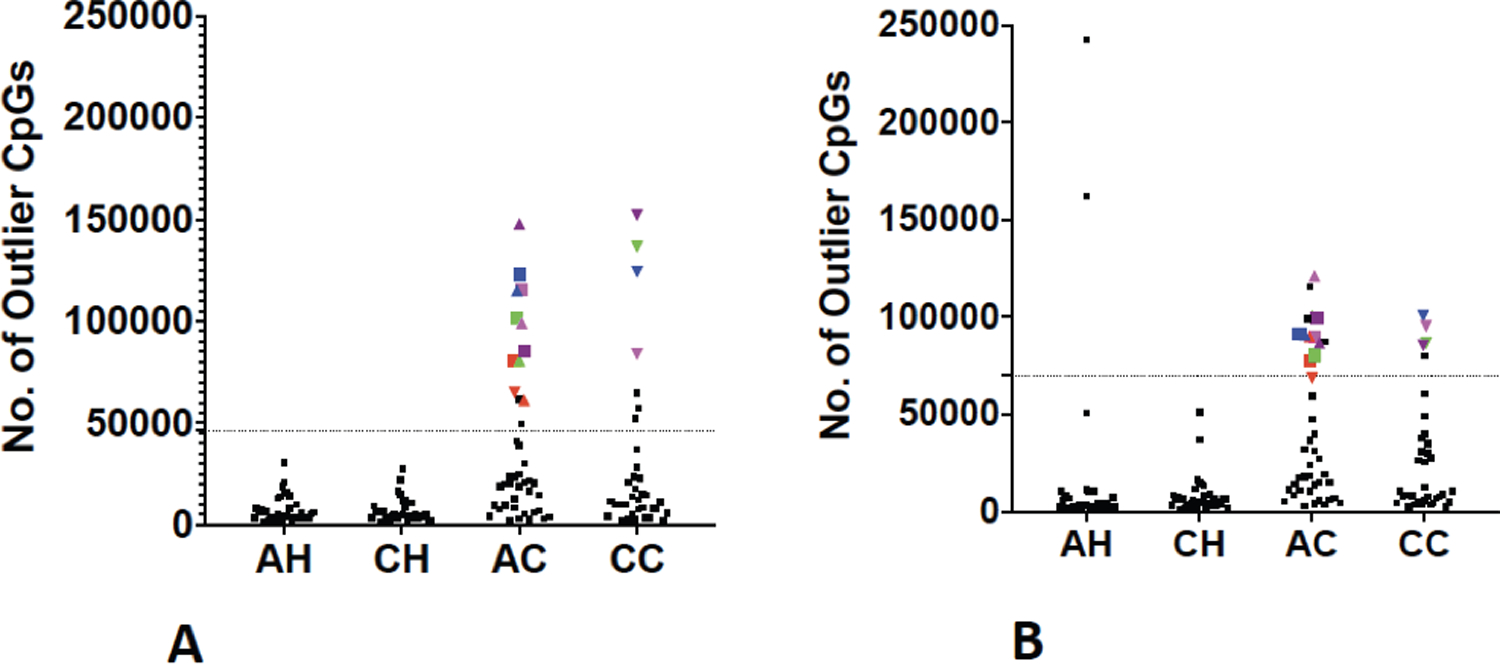
Number of CpGs in which a sample is (A) Hypermethylated outlier (B) Hypomethylated outlier. Dotted line indicates outlier boundary. Each symbol is a sample. Symbols above the dotted lines are outliers in respective plots. Colored symbols indicate samples who are outliers in both the plots and are termed as “OMPs”. Samples represented by colored symbols are OMPs. Same color and shape show the same individuals in both the plots. AH African American Healthy; CH Caucasian Healthy; AC African American Cancer; CC Caucasian Cancer.