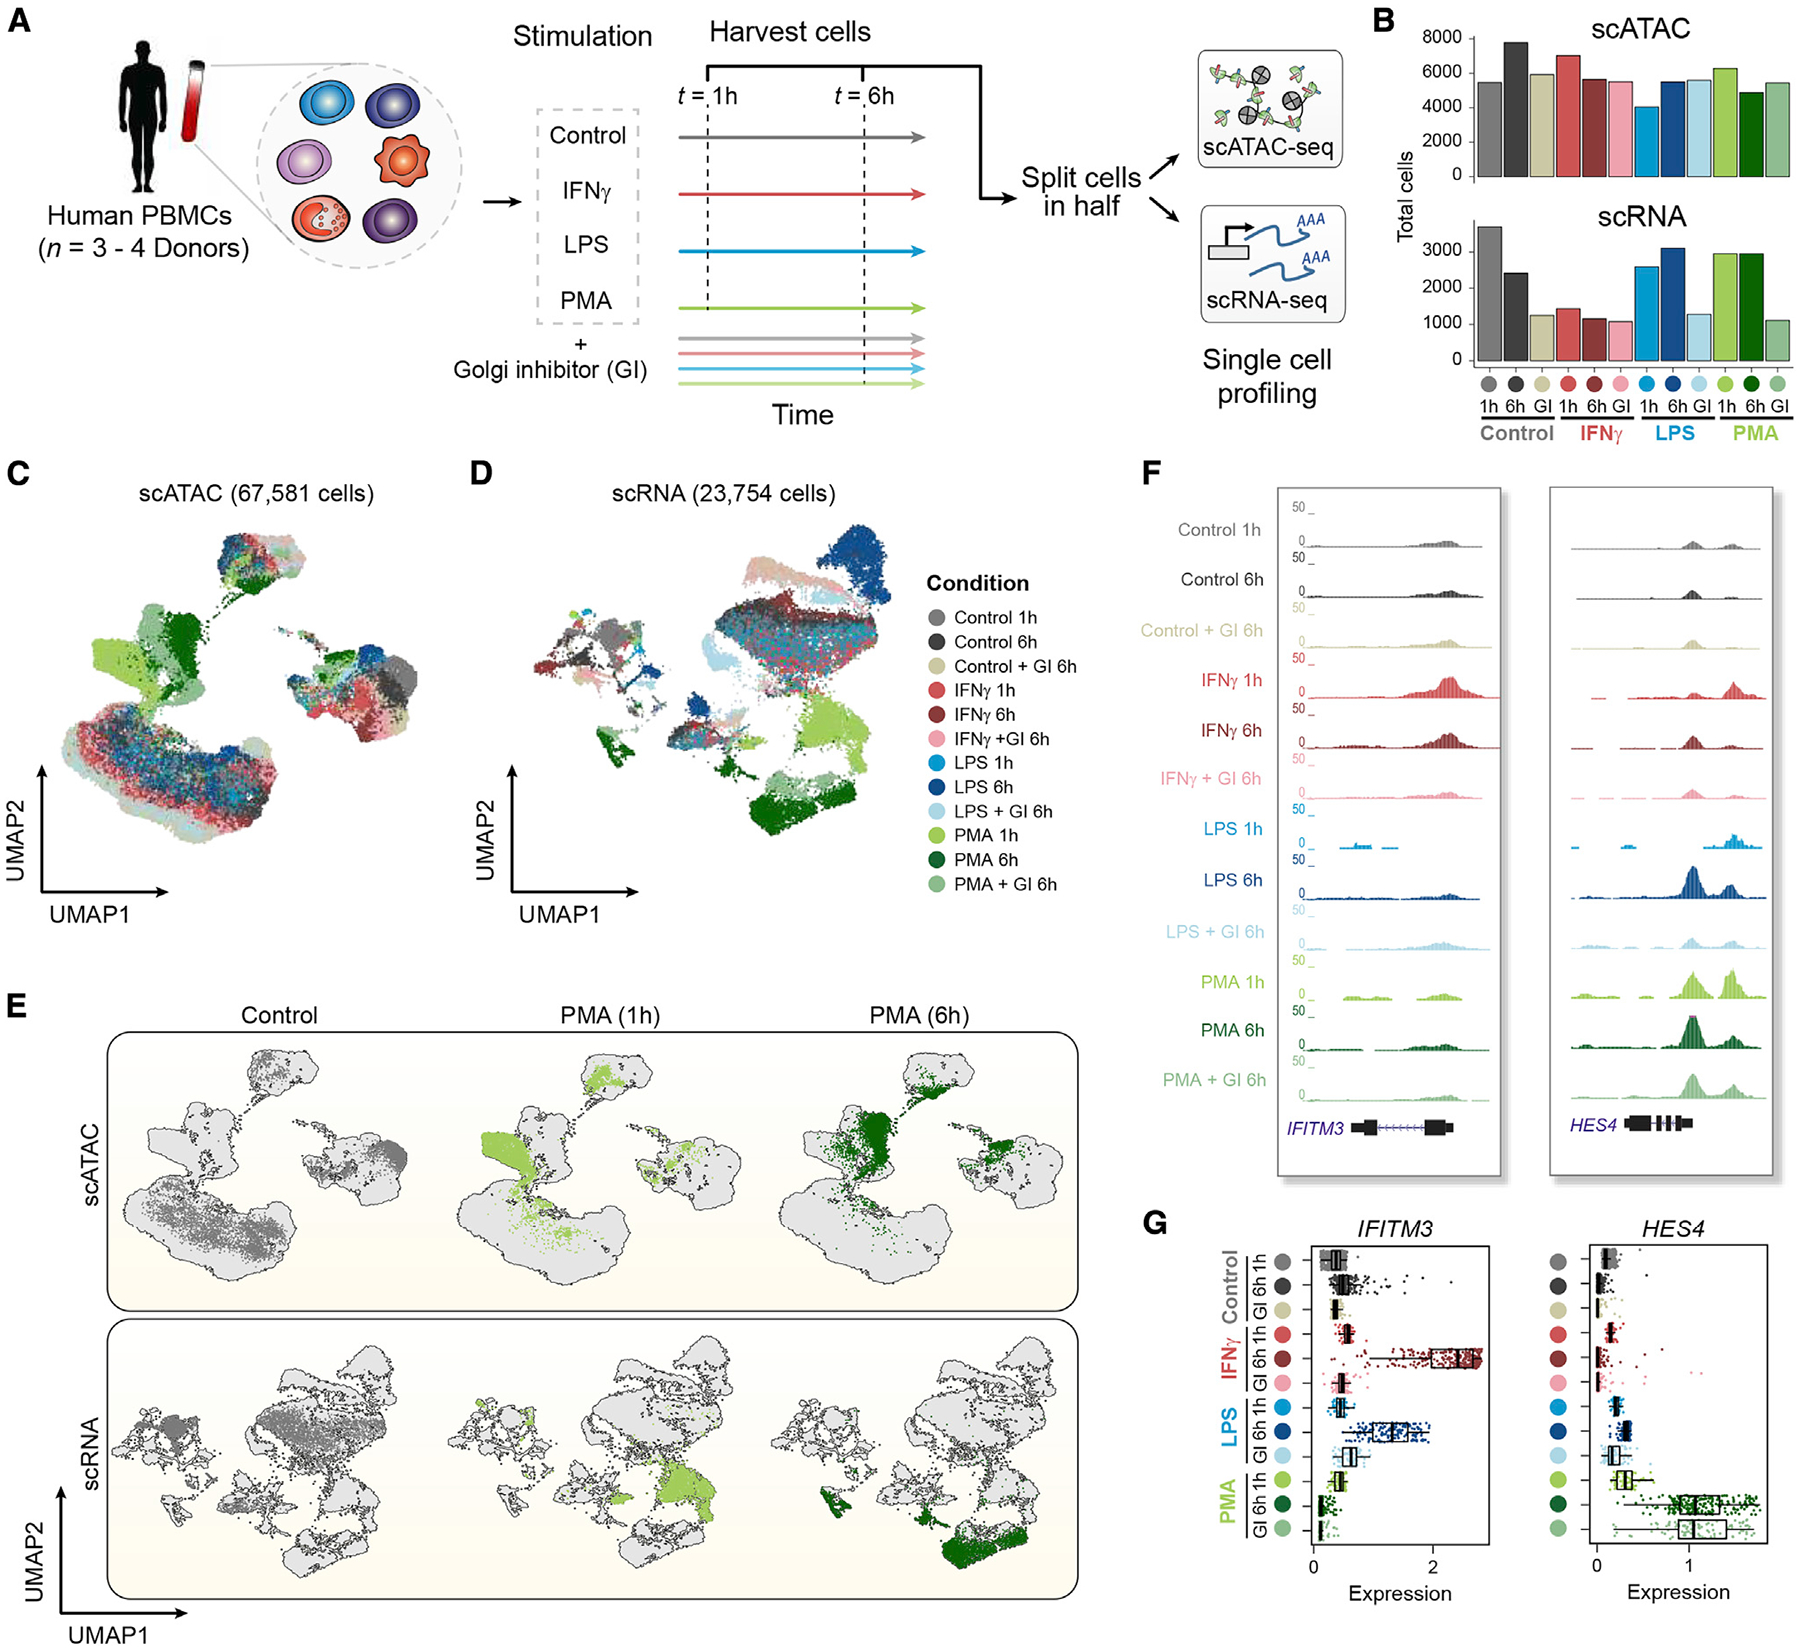
Figure 1. High-throughput single-cell epigenomic and transcriptional profiling of resting and stimulated human blood cells.

(A) Schematic highlighting design of stimulation experiment. Human peripheral blood mononuclear cells (PBMCs) were stimulated with DMSO control, lipopolysaccharide (LPS), interferon gamma (IFN-Ɣ), or phorbol myristate acetate (PMA) plus ionomycin for 1 or 6 h with or without a Golgi inhibitor (GI) for the 6-h treatment condition. Cells were then split and profiled using scATAC-seq and scRNA-seq for each condition and time point considered.
(B) Total number of cells profiled per condition passing quality control filtering for scATAC and scRNA-seq.
(C) Uniform manifold approximation and projection (UMAP) of scATAC-seq cells based on latent semantic indexing (LSI) dimensionality reduction, with cells colored by treatment condition.
(D) UMAP of scRNA-seq cells based on principal-component analysis (PCA) dimensionality reduction, with cells colored by treatment condition.
(E) UMAPs of scATAC-seq cells (top) and scRNA-seq cells (bottom), highlighting individual conditions under control (6 h) and PMA (1 and 6 h) conditions.
(F) Aggregate accessibility profiles for scATAC-seq monocyte cells around genes IFITM3 and HES4.
(G) Distribution of single-cell expression levels based on the imputed scRNA-seq counts for stimulation-specific gene markers shown in (F) per condition for scRNA-seq monocyte cells.
