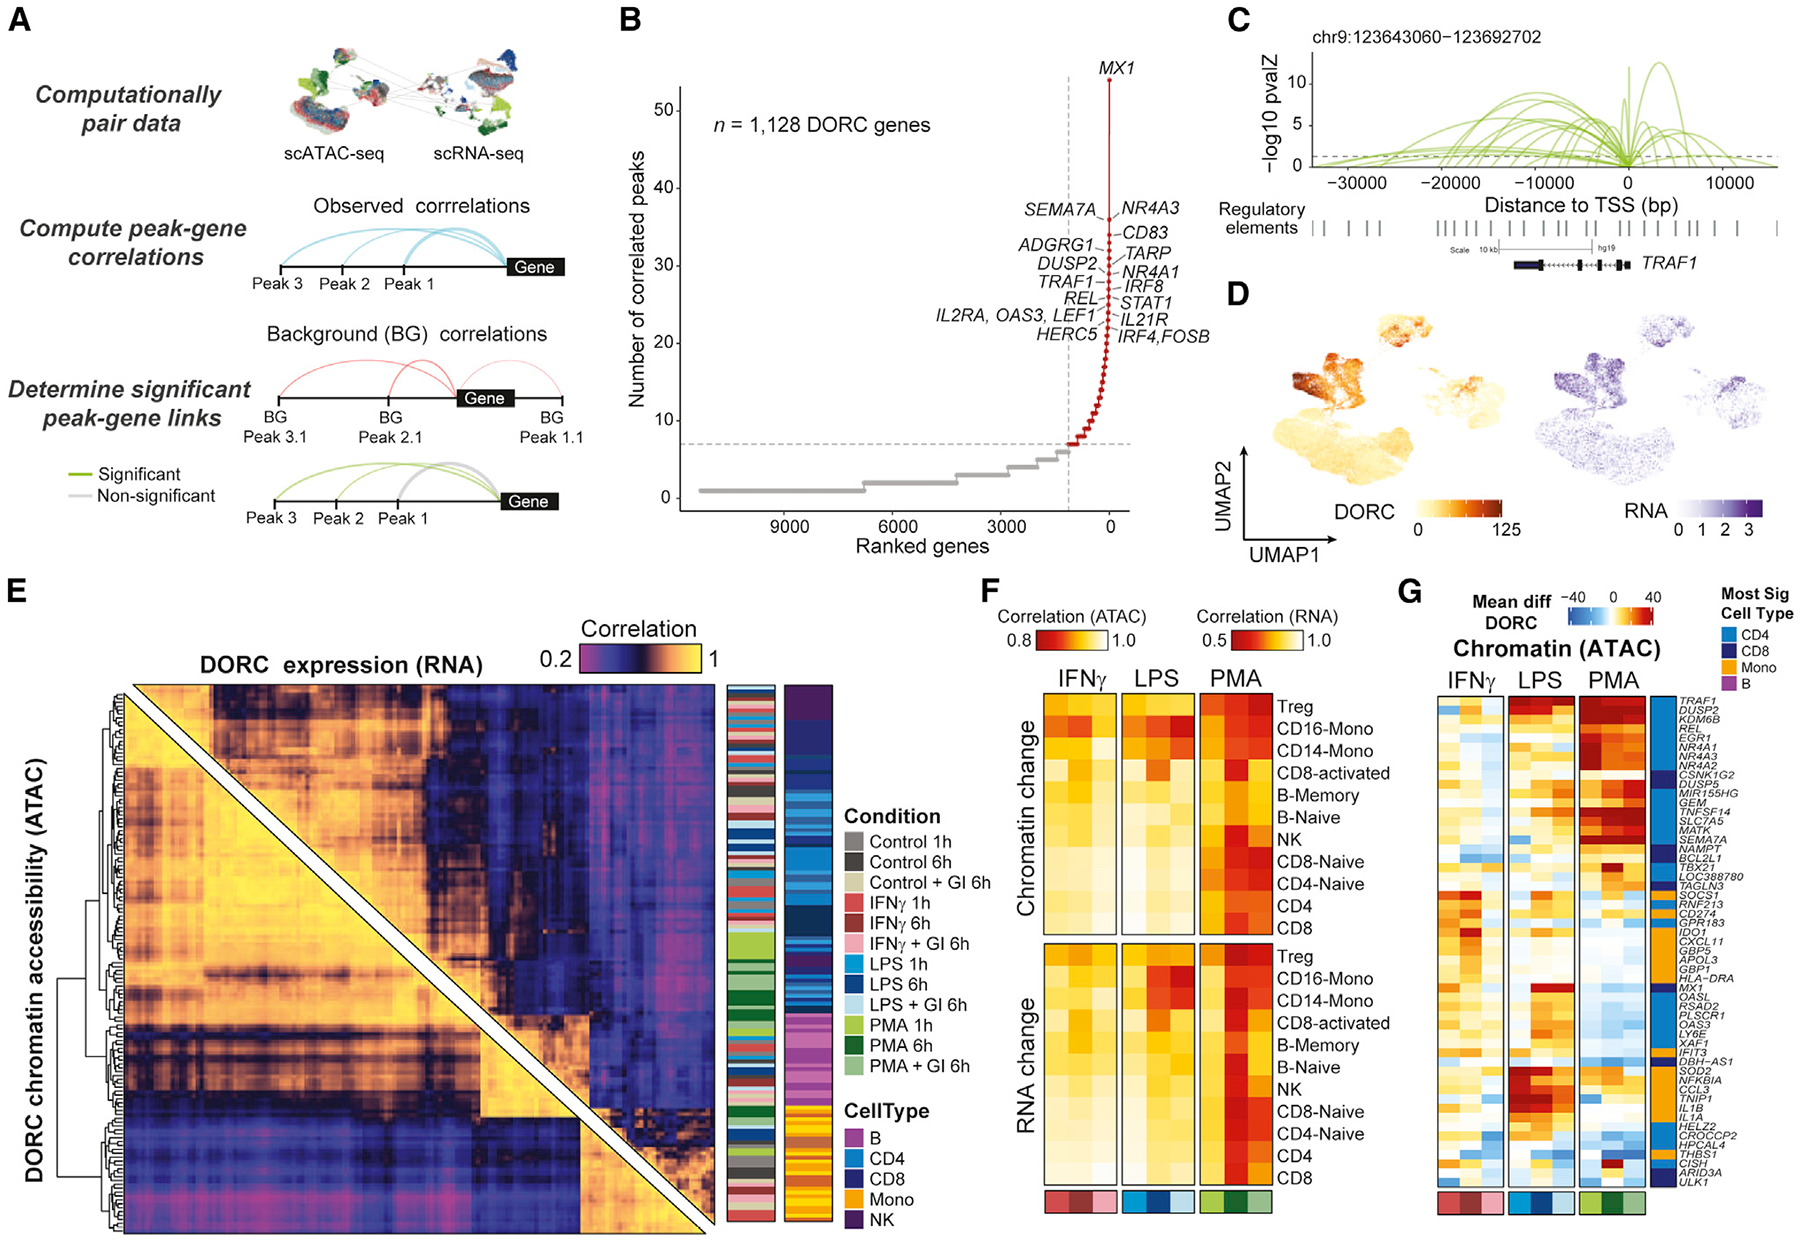
Figure 3. Integrative multi-omics analysis identifies key regulatory modules associated with stimulus response in single cells.

(A) Schematic of cis-regulatory analyses for identification of significant chromatin accessibility peak-gene associations using computationally paired scATAC-seq and scRNA-seq stimulation datasets.
(B) Top hits based on the number of significant gene-peak correlations across all cell types and stimulus conditions.
(C) Loop plots highlighting significant peak-gene associations for DORC TRAF1, determined using the approach outlined in (A).
(D) UMAP of DORC accessibility scores (left) and paired RNA expression (right) for TRAF1.
(E) Pairwise Pearson correlation of aggregate DORC accessibility scores and RNA expression of cells per condition per cell type across all DORCs, clustered using hierarchical clustering by DORC score correlations.
(F) Global DORC accessibility (top) and gene expression (bottom) change displayed based on the Pearson correlation coefficient of the aggregate score across DORCs for each stimulation condition versus its corresponding control condition, shown per condition per cell type annotation.
(G) Heatmap showing the mean difference in single-cell DORC accessibility for the union of the top 10 differential DORCs across conditions and cell types (n = 53 genes). The cell type color bar represents the cell group having the most significant change across all conditions for that assay.
