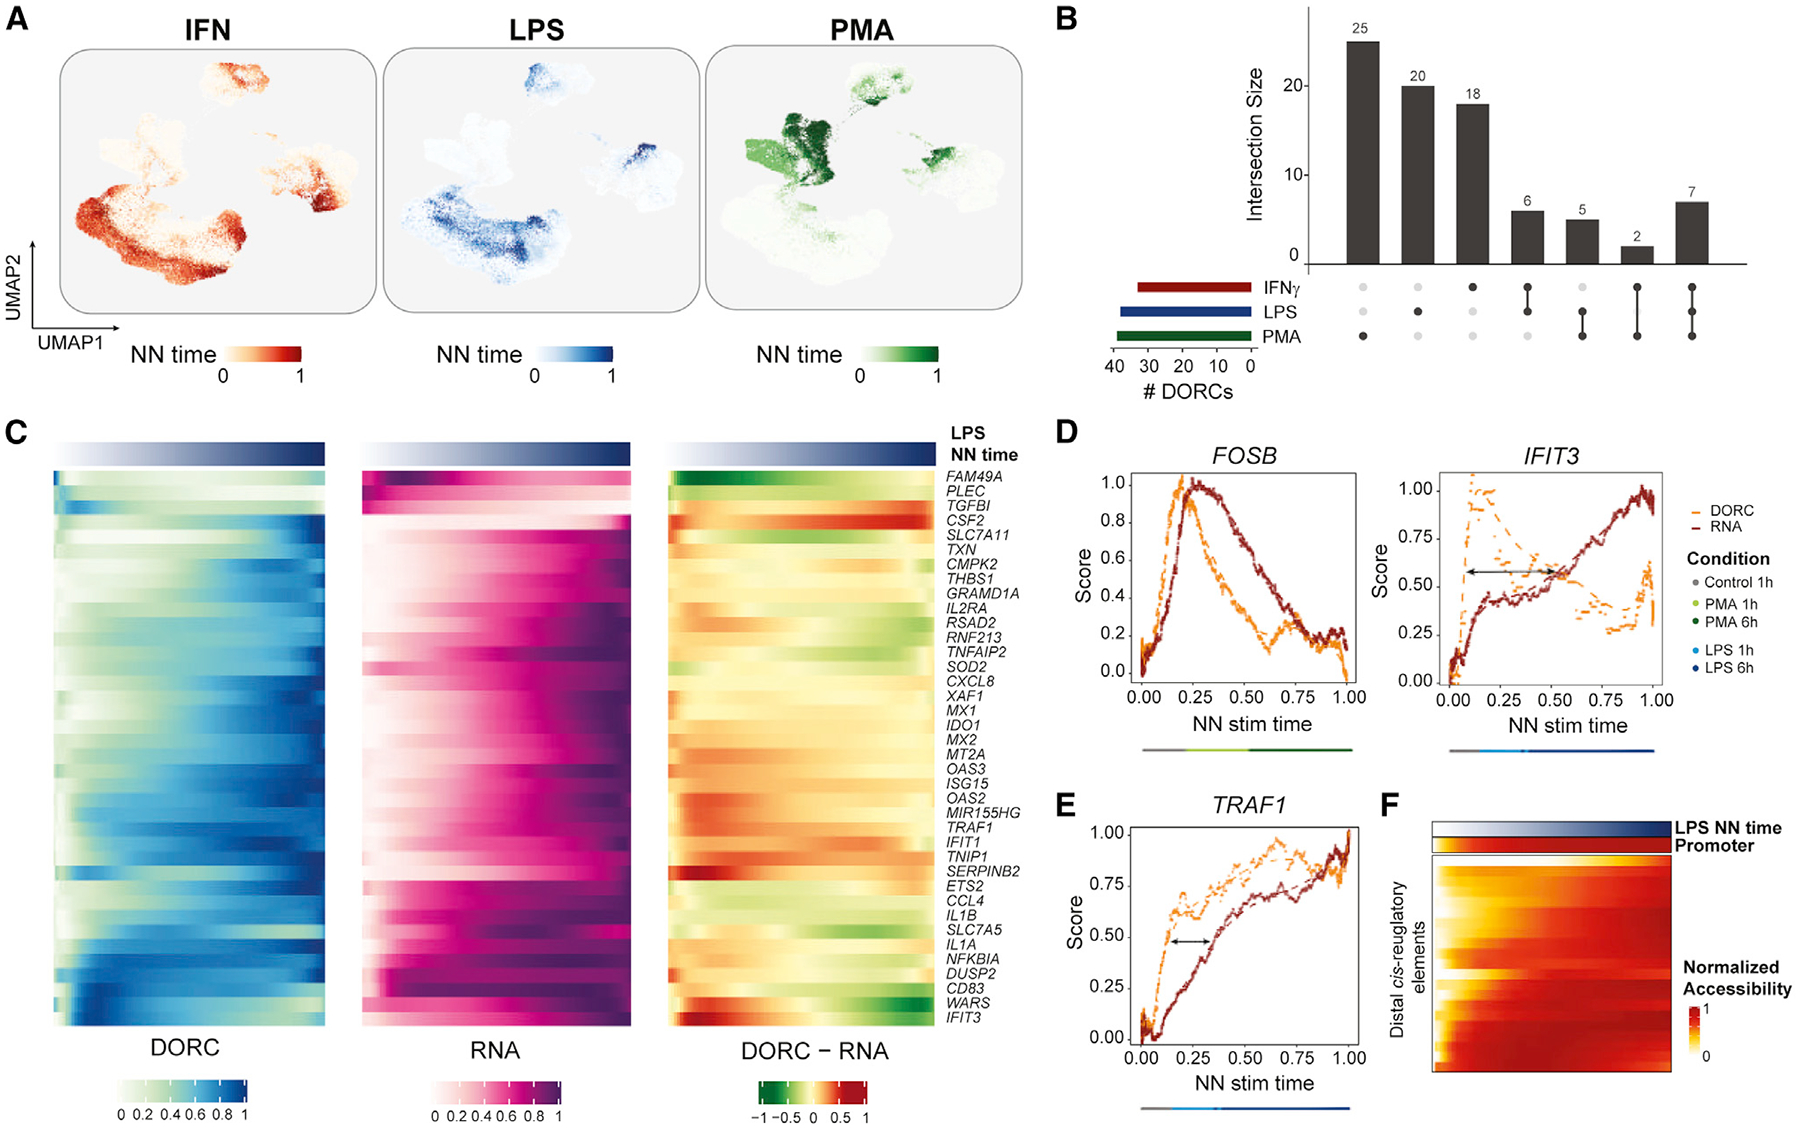
Figure 4. Chromatin and gene expression dynamics with respect to stimulus response time.

(A) UMAP of scATAC cells colored by estimated NN stimulation (stim) time per stimulus condition.
(B) UpSet plot highlighting overlap of monocyte-constrained DORC genes determined for the three different stimulus conditions.
(C) Heatmaps highlighting smoothed normalized DORC accessibility, RNA expression, and residual (DORC-RNA) levels for DORC genes (n = 38) identified to be associated with LPS NN stimulation time in control (1 h) and stimulated (1 h/6 h) monocytes (n = 1,776 cells).
(D) Chromatin (DORC) versus gene expression (RNA) dynamics of DORCs FOSB (left) and IFIT3 (right) with respect to smoothed PMA and LPS NN stim time, respectively, for control (1 h) and stimulated (1 h/6 h) monocytes (n = 2,002 cells for PMA + control, n = 2,601 cells for IFNƔ + control). A dotted line represents a LOESS fit to the values obtained from a sliding average of DORC accessibility or RNA expression levels (n = 100 cells per sliding window bin). The color bar indicates the most frequent (mode) cell condition within each bin.
(E) Same as in (D) but for TRAF1 with respect to LPS-stimulated and control (1 h) monocytes.
(F) Smoothed accessibility scores for individual cis-regulated elements correlated with TRAF1 expression in control and LPS-stimulated monocytes shown in (D), ordered by LPS NN stim time.
