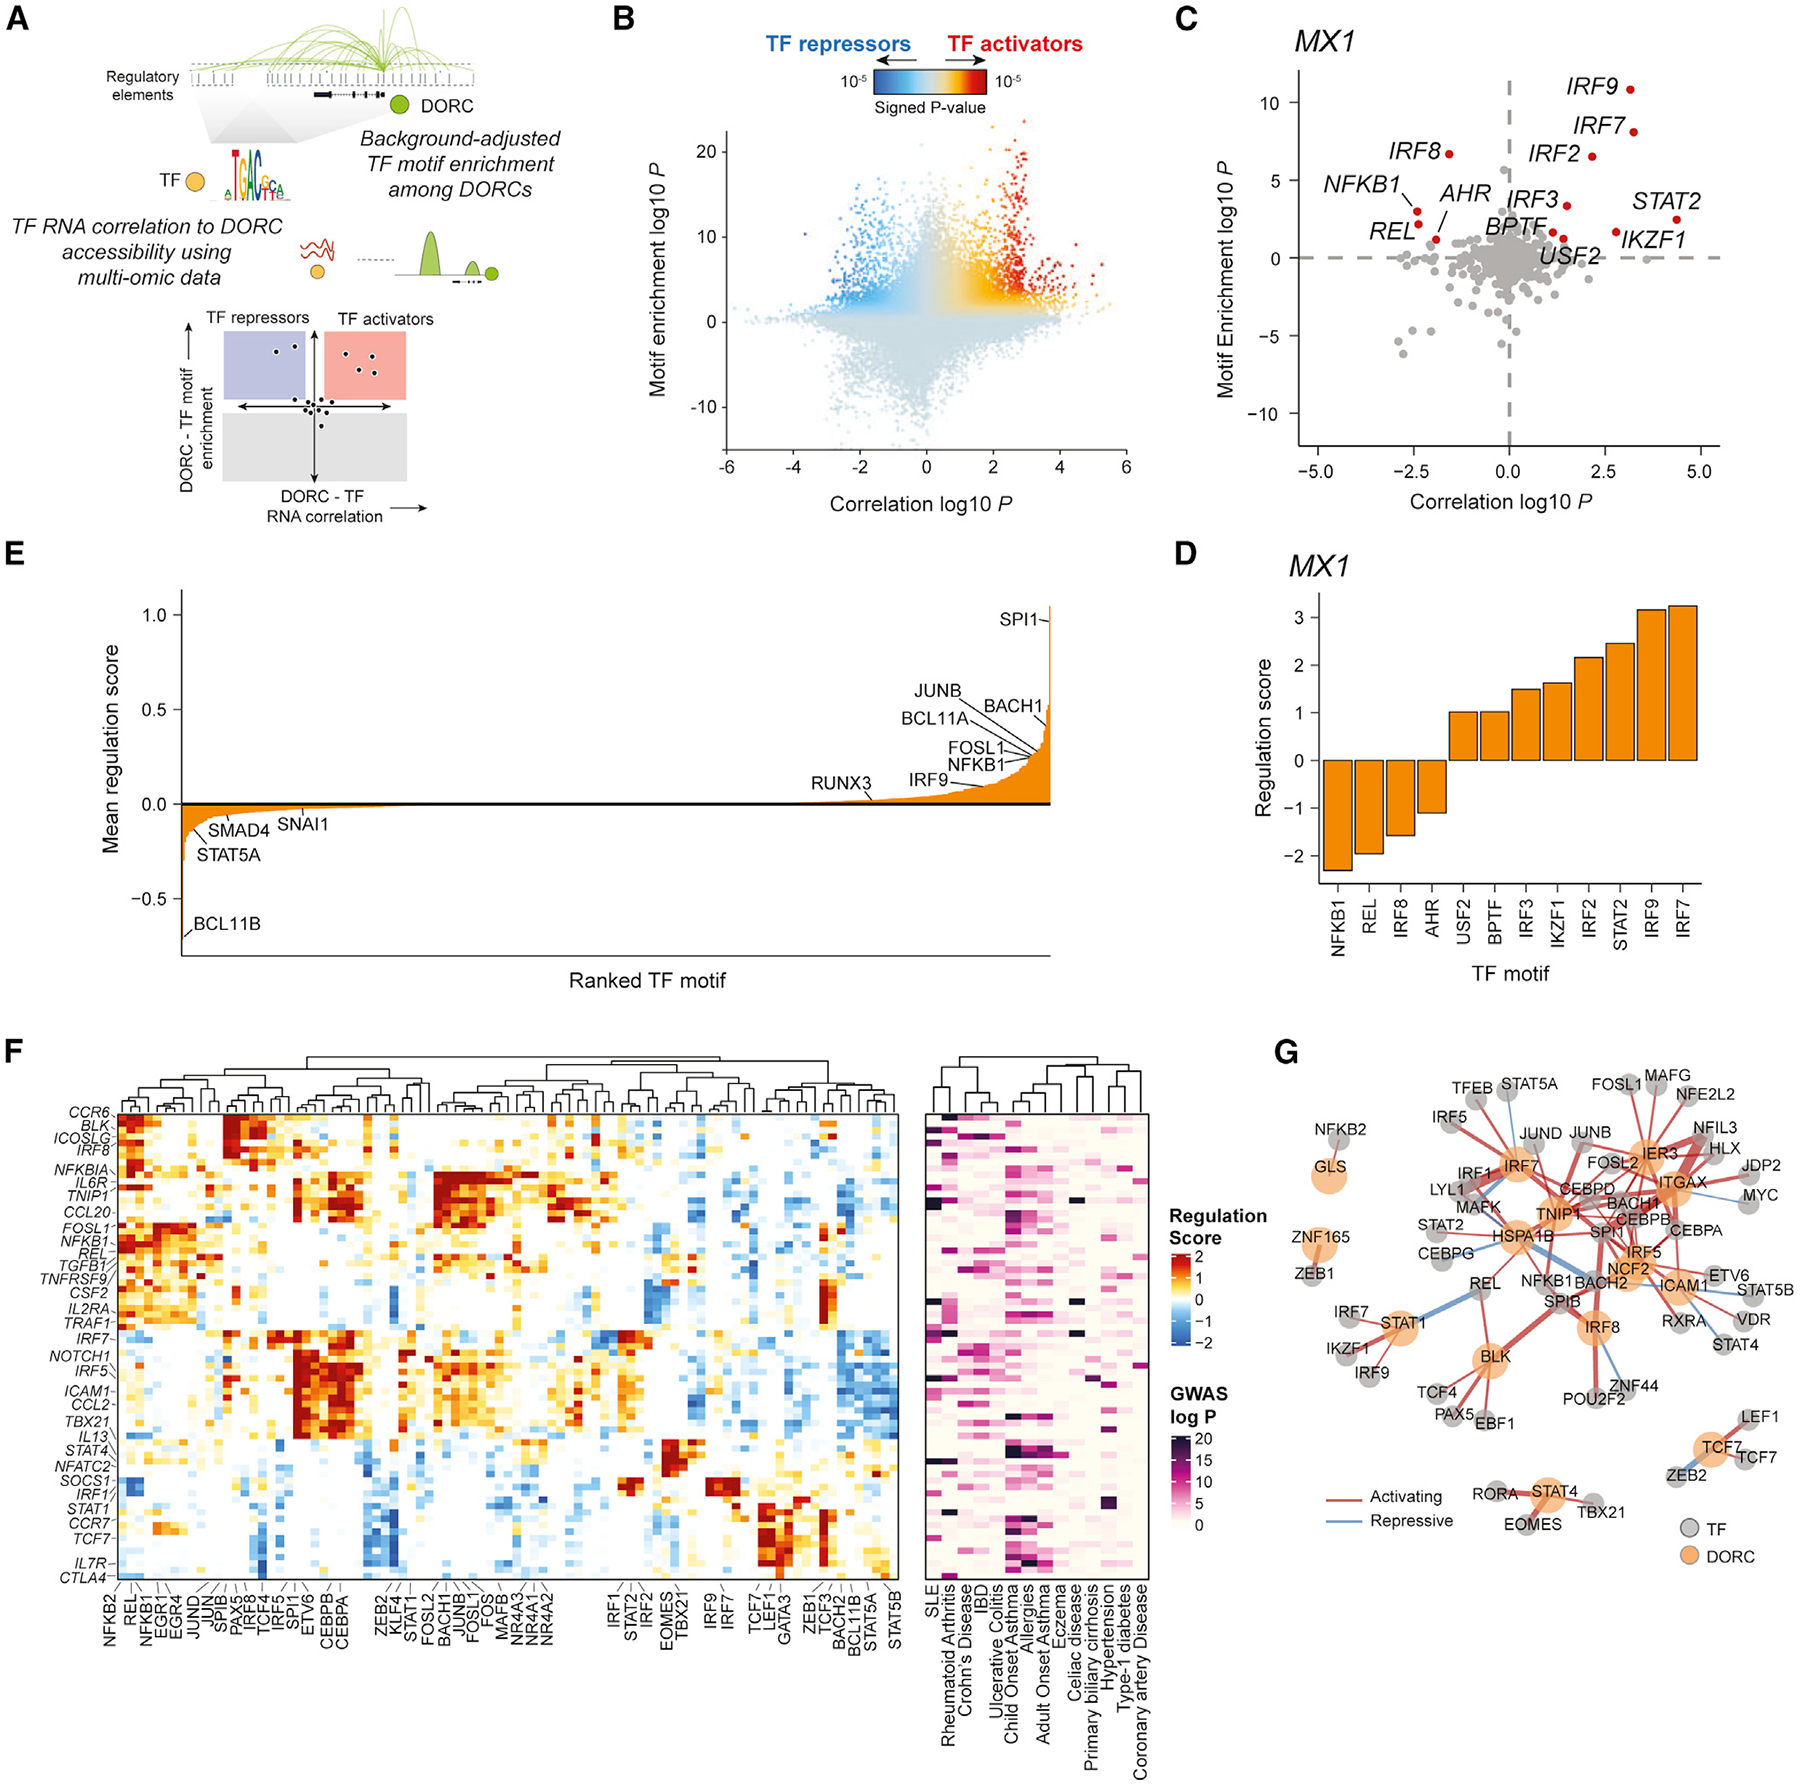
Figure 5. Design and application of FigR’s gene regulatory network (GRN) workflow to identify TF modulators of immune response DORCs.

(A) Schematic describing the FigR GRN workflow.
(B) Scatterplot showing all DORC-to-TF associations, colored by the signed regulation score.
(C) Candidate TF regulators of MX1. Highlighted points are TFs with abs(regulation score) ≥ 1 (−log10 scale), with all other TFs shown in gray.
(D) Regulation scores (signed, −log10 scale) for the highlighted TFs in (C).
(E) Mean regulation score (signed, −log10 scale) across all DORCs (n = 1,128) per TF (n = 870), highlighting select TF activators (right skewed) versus TF repressors (left skewed).
(F) Heatmap of DORC regulation scores (left) for all significant TF-DORC enrichments for DORCs implicating GWAS variants (abs(regulation score) ≥ 1.5; n = 89 TFs, n = 73 DORCs). The corresponding minimum GWAS P (right; −log10 scale) for each DORC across all diseases considered is also shown.
(G) TF-DORC network visualization for SLE GWAS SNP-implicated DORCs (orange nodes) and their associated TFs (gray nodes) from (F). Edges are scaled and colored by the signed regulation score.
